Why measuring the clean energy economy is a game of catch-up

Last month, the US Bureau of Economic Analysis published its annual revision to US national accounts — key economic figures such as gross domestic product, national income and household savings rates. The upshot: The US economy is bigger than previously thought. The revised numbers show the economy grew faster than the bureau had estimated in 2017, 2018 and 2019, and shrank less in 2020.
One of the updates is particularly relevant to clean energy and climate. It is more than a data revision. It is a story about how established systems react (or don’t) to rapidly evolving signals of significant economic change. And it is a story of two sharp-eyed economists and one thoughtful institution making an effort to reflect reality at a noisy time.
The first economist is Neil Mehrotra of the Federal Reserve Bank of Minneapolis. In a thread on X, the site formerly known as Twitter, Mehrotra reflected on how, while working on the climate provisions of the Inflation Reduction Act, he came across the previous BEA data, and it showed a steadily increasing price index for “investment in electric power structures” (essentially, rising costs to build electric power generation plants or assets) from 2010 through 2023.
But as many Bloomberg Green readers will know, costs for renewable power assets have been steadily and significantly declining for almost that whole time. The big buildout of renewables means costs ought to be going down, not up.
The bureau had used a private data series called the Handy-Whitman Index for its price index. Mehrotra pointed it toward data from the US Energy Information Administration, the US Census Bureau and other sources, which showed more or less flat costs for natural gas plants and falling costs for wind and solar.
A spokeswoman for the bureau confirms that Mehrotra’s questions nudged its economists to research the topic further. “BEA is constantly looking for ways to improve our statistics, including partnering with outside researchers, data providers and data users to improve our methodology and how data are presented,” she said.
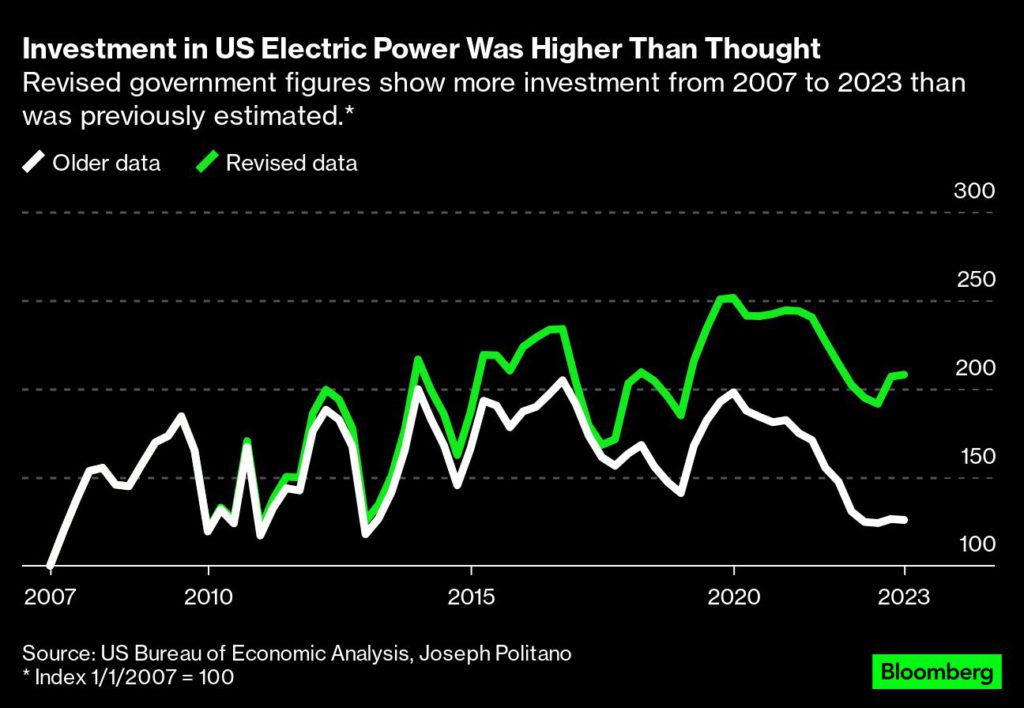
The end result should please government data aficionados: After contacting the EIA for better data on wind and solar investment, the economists arrived at a lower cost estimate for power structures — and a picture of more physical investment for the same invested dollars.
That improvement in data flows through, if in a small way, to newly revised US GDP figures.
Which brings us to the second economist. Joseph Politano is a former analyst at the US Bureau of Labor Statistics who now publishes his own economics newsletter . He found that the BEA’s downwards-revised cost estimates resulted in a 65% upward revision in the amount of real investment in the US power sector.

The revisions, Politano said, “allow official GDP data to reflect a reality we’ve known for a long time — renewables are getting cheaper and more efficient while becoming a larger share of America’s economy.”
They also exemplify the lag between any new, disruptive technology and official attempts to reckon with its impact, he noted. “Nonexistent tech can’t yet be measured by definition, so agencies are fundamentally unable to prepare for upcoming technological revolutions, and in practice they have to wait until goods gain significant market share before they can collect reliable data worthy of official endorsement,” Politano said in an email.
Or in Mehrotra’s words, “the clean energy transition and climate change will involve a host of challenges for economic measurement.” To help address that, there “can probably be a lot of useful collaboration between climate scientists, economists and statistical agencies,” he said.
New technology not only requires us to measure it as clearly and as quickly as we can. It also requires us to have a clearly articulated theory of change — how technologies themselves change, and how they change the systems into which they expand. In the case of renewables, wind and solar have experienced both exceptional growth and exceptional cost improvement, and that calls for high-frequency price indexing of their specific data.
The BEA has embraced the change. As Mehrotra said at the end of his thread, “I was impressed by the thoughtfulness and thoroughness of [bureau employees who] looked into this. Their work is incredibly important and too often overlooked or dismissed.”
Fortunately, the new assessment doesn’t overlook the reality of investment in clean power. And more generally, the BEA’s efforts provide an example of how a government agency can do its best to assist the future. Measuring the impact of new technologies, especially when those technologies are growing from a low baseline, gives investors and planners the information to better reflect not just on what is, but what could be.
(By Nathaniel Bullard)
{{ commodity.name }}
{{ post.title }}
{{ post.date }}


Comments