Gold stocks’ spring rally 7

The gold miners’ stocks have mostly been consolidating sideways over this past half-year. They’ve been held down by periodic bouts of heavy gold-futures dumping on Fed-tightening fears. But as those traders exhaust their selling firepower, gold stocks have formed a strong technical base that is birthing their next major bull-market upleg. And a stiff tailwind is mounting as gold stocks enter their strongest season of the year.
Gold stocks exhibit strong seasonality because their price action mirrors that of their dominant primary driver, gold. Gold’s seasonality generally isn’t driven by supply fluctuations like grown commodities see, as its mined supply remains relatively-steady year-round. Instead gold’s major seasonality is demand-driven, with global investment demand varying considerably depending on the time in the calendar year.
This gold seasonality is fueled by well-known income-cycle and cultural drivers of outsized gold demand from around the world. Like clockwork these power major spring, autumn, and winter seasonal rallies in gold and thus its miners’ stocks. Interestingly market forces behind the former are the least-understood out of all gold’s seasonal surges. Maybe that’s why this imminent spring rally has also proven gold’s weakest.
Yet surprisingly gold stocks still enjoy their best seasonal outperformance relative to their metal during these same coming months! So gold stocks’ spring rally has proven their strongest seasonal one during gold’s modern bull-market years. This contradictory mismatch between gold’s worst seasonal rally and its miners’ best one offers an important clue on the spring rally’s motivating impetus, sentiment is the key.
Traders’ psychology exceedingly influences their capital-allocation decisions. They won’t buy gold or gold stocks or anything unless they are optimistic prices will climb on balance. After dark cold winters in the northern hemisphere where the vast majority of the world’s traders live, spring naturally breeds optimism. Its glorious expanding sunshine and warming temperatures universally buoy the spirits of nearly everyone.
The lengthening daylight hours and improving weather from March to May bring joyful anticipation of the summer vacation season. That’s such a wonderful contrast to January and February, which often seem like nose-to-the-grindstone months of relentless busyness. With things looking up and traders generally feeling happier during springs, their optimism makes them more bullish on much including gold and gold stocks.
This glass-half-full sentiment leaves traders more willing to deploy capital to chase expected gains. And their optimistic buying feeds on itself, fueling virtuous circles of strength. The more traders buy gold and its miners’ stocks, the more they rally. Those resulting gains attract in still-more traders, accelerating the upside. Spring is exceptionally-favorable for nurturing this positive psychological feedback loop in markets.
Since it is gold’s own demand-driven seasonality that fuels gold stocks’ seasonality, that’s logically the best place to start to understand what’s likely coming. Price action is very different between bull and bear years, and gold remains in a middle-aged bull market. After falling to a 6.1-year secular low in mid-December 2015 as the Fed kicked off its last rate-hike cycle, gold powered 29.9% higher over the next 6.7 months.
Crossing the +20% threshold in March 2016 confirmed a new bull market was underway. Gold corrected after that sharp initial upleg, but normal healthy selling was greatly exacerbated after Trump’s surprise election win. Investors fled gold to chase the taxphoria stock-market surge. Gold’s correction cascaded to serious proportions, hitting -17.3% in mid-December 2016. But that remained shy of a new bear’s -20%.
Gold rebounded sharply from those severe-correction lows, nearly fully recovering by early September 2017. But it failed to break out to new bull-market highs, then and several times after. That left gold’s bull increasingly doubted, until June 2019. Then gold surged to a major decisive breakout confirming its bull remained alive and well! Its total gains grew to 96.2% over 4.6 years by early August 2020, still modest.
Gold’s previous mighty bull market ran from April 2001 to August 2011, where it soared 638.2% higher! And while gold consolidated high in 2012, that was technically a bull year too since gold just slid 18.8% at worst from its bull-market peak. Gold didn’t enter formal bear-market territory until April 2013, thanks to the crazy stock-market levitation driven by extreme distortions from the Fed’s QE3 bond monetizations.
So the bull-market years for gold in modern history ran from 2001 to 2012, skipped the intervening bear-market years of 2013 to 2015, then resumed in 2016 to 2022. Thus these are the years most relevant to understanding gold’s typical seasonal performance throughout the calendar year. We’re interested in bull-market seasonality, because gold remains in its latest bull today and bear-market action is quite dissimilar.
Prevailing gold prices varied radically through these modern bull years, running between $257 when gold’s last secular bull was born to August 2020’s latest record high of $2,062. All those long years with that vast range of gold levels have to first be rendered in like-percentage terms in order to make them perfectly-comparable. Only then can they be averaged together to distill out gold’s bull-market seasonality.
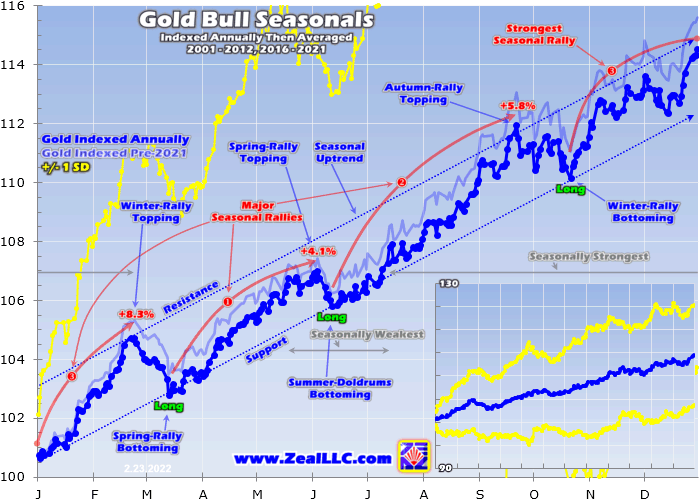
That’s accomplished by individually indexing each calendar year’s gold price action to its final close of the preceding year, which is recast at 100. Then all gold price action of the following year is calculated off that common indexed baseline, normalizing all years regardless of price levels. So gold trading at an indexed level of 110 simply means it has rallied 10% from the prior year’s close, while 95 shows it is down 5%.
This chart averages the individually-indexed full-year gold performances in those bull-market years from 2001 to 2012 and 2016 to 2021. 2022 isn’t included yet since it remains a work-in-progress. This bull-market-seasonality methodology reveals that gold’s spring rally is its last push higher before the summer doldrums arrive. While this is gold’s smallest seasonal rally of the year, the gold stocks greatly leverage it.

Gold’s 2021 performance was relatively-weak, with this metal ultimately drifting 3.6% lower in a high consolidation. Early on last year gold remained in a healthy correction after a pair of massive bull-market uplegs crested in 2020. Then during the past half-year or so starting mid-summer, gold was slammed by periodic bouts of heavy-to-extreme gold-futures selling on Fed-tightening fears. That left gold really out of favor.
Before 2021, gold averaged excellent 15.6% annual gains in these modern bull-market years. This pre-2021 seasonality is rendered in light-blue in this chart. But last year’s major seasonal underperformance dragged down the average to the dark-blue dotted line. That’s a rather-large drop, especially considering this data series is fully 18 years averaged together. But gold’s strong bull seasonality remains very much intact.
Including last year’s Fed-tightening-fear-stunted gold action, this metal still averaged hefty 14.5% yearly gains across this long secular span. Those remain very impressive, enough to double investors’ capital every five years. Gold’s average indexed seasonal performance from 2001 to 2012 and 2016 to 2021 formed a tight seasonal uptrend. Gold’s trio of major seasonal rallies pushed it higher within that rising channel.
Chronologically those start with gold’s spring rally, again the weakest averaging 4.1% gains between mid-March to early June. I suspect this is the case because this seasonal rally is driven more by sentiment than fundamentals. That ethereal spring market optimism seems to push gold higher during the coming months. Gold’s other two seasonal rallies are directly fueled by large bullion buying from Asia and the West.
The autumn rally enjoys larger 5.8% average gains in these modern gold-bull years, from mid-June to late September. Indian-wedding-season jewelry buying is its main driver. Then gold’s subsequent winter rally from late October to late February grows much bigger, averaging fat 8.3% gains more than doubling the spring rally! Big Western jewelry buying heading into Christmas then later Chinese New Year buying contribute.
But gold’s spring rally is nothing to sneeze at, as 4.1% average gains over just 2.7 months annualize out to +18.2%. That’s considerably better than that 14.5% seasonal gold advance in these modern bull-market years. Gold’s spring rally is the fastest of these seasonal ones, giving the yellow metal less time to power to bigger gains. The autumn and winter rallies unfold over 3.4 and 4.1 months, helping them grow larger.
April is the heart of gold’s spring seasonal rally, averaging strong calendar-month gains of 1.9% during this span. That ranks as this metal’s third-best month seasonally, behind January’s massive 2.8% and August’s big 2.0%. So these spring months have proven an important and profitable time to be deployed in gold. And this imminent 2022 gold spring seasonal rally has much-better upside potential than usual.
Multiple major bullish drivers are converging that should fuel an accelerating bull-market upleg. In recent essays I analyzed each in turn. Gold just made a major upside breakout from a gigantic chart formation, a bullish pennant pattern! That is working wonders to attract legions of gold-futures speculators, who love chasing upside momentum. Their buying will drive gold high-enough for long-enough to entice back investors.
Big investment buying is necessary to fuel major gold uplegs, since investors’ vast pools of capital dwarf gold-futures speculators’. Investors have already started returning to gold, as evident in the holdings of its leading and dominant gold exchange-traded funds. American stock-market capital is migrating back into gold through the GLD SPDR Gold Shares and IAU iShares Gold Trust ETFs, a bullish omen for this metal.
Gold investment demand will see a massive boost from the raging inflation unleashed by this profligate Fed. Despite being intentionally-lowballed, the latest US Consumer Price Index print soared 7.5% year-over-year! That was its hottest read since February 1982! These fast-rising prices are fueled by the Fed expanding its balance sheet an insane 114.3% or $4,752b in just 23.7 months since March 2020’s stock panic!
During the last similar serious inflation spikes in the 1970s, gold tripled during the first and more than quadrupled in the second! Gold should at least double before this current inflation spike runs its course, this ultimate inflation hedge can’t keep dramatically lagging inflation for long. Radically-more money has been force-fed into the system, competing for and bidding up the prices on far-slower-growing goods and services.
Gold-futures speculators’ deep fears of rate hikes are highly-irrational. The Fed has executed fully twelve rate-hike cycles since 1971. Gold averaged 29.2% gains across the exact spans of all dozen. It rallied during eight, averaging huge 49.0% absolute gains! In the other four, gold only fell an asymmetrically-small 10.5% on average. Gold fared best when it entered rate-hike cycles relatively-low and they were gradual.
That means no more than one quarter-point hike per regularly-scheduled FOMC meeting. Gold is low technically today after grinding lower to sideways since August 2020, and the Fed can’t risk hiking too fast. That would tank these extreme QE-levitated stock markets trading at dangerous bubble valuations. And the Fed has caved on past tightenings once stock markets threaten new bears at 20%+ total losses.
So gold investment demand should strengthen considerably in this usual spring-rally timeframe, really amplifying those seasonal gains. American stock investors have vast room to buy, since they remain radically-underinvested in gold. Exiting January, total GLD+IAU gold-bullion holdings were only worth $87.3b. That was just 0.2% of the elite S&P 500 stocks’ collective $39,866.7b market cap, effectively zero!
Naturally the gold miners’ own seasonality is directly driven by gold’s. The GDX VanEck Gold Miners ETF remains the leading gold-stock benchmark and trading vehicle. It tends to amplify material gold-price moves by 2x to 3x. That means an outsized gold spring rally should translate into way-larger gold-stock gains. Gold stocks’ young upleg growing on mounting upside momentum in gold will attract traders back in.
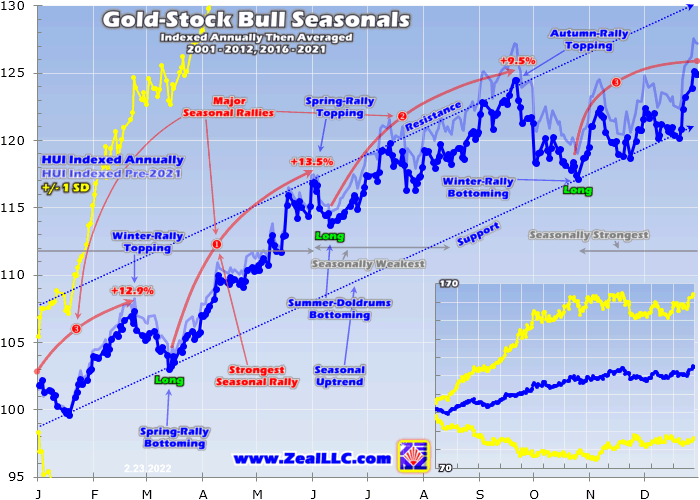
This next chart applies this same modern-gold-bull-year seasonality methodology to gold stocks. Since GDX was born later in May 2006, its price history is still insufficient for longer-term studies. Thus the classic HUI gold-stock index is used instead. GDX and the HUI closely track each other, they are functionally-interchangeable containing most of the same major gold miners. Their spring rally is fueled by gold’s.

That spring optimism driving gold higher proves much more potent for gold miners’ stocks. Between mid-March to early June in these same modern gold-bull years of 2001 to 2012 and 2016 to 2021, the HUI averaged outstanding 13.5% gains! That makes for gold stocks’ biggest and fastest seasonal rally of the year, way outperforming the metal that drives their profits. Spring gold-stock upside leverage to gold runs a big 3.3x!
That doubles the subsequent autumn and winter seasonal rallies’ upside leverage of 1.6x each. The best time seasonally to be long gold stocks is during this imminent spring rally. That’s when this sector wins the biggest fraction of its annual gains. And those have been extraordinary, averaging fantastic 25.0% yearly gains during these gold-bull years! Compounding such hefty returns doubles capital in just three years.
And that’s after gold stocks’ average seasonal trajectory was dragged down last year by very-weak price action. In 2021 GDX dropped 11.1%, amplifying gold’s loss by 3.1x. Prior to that, gold-stock seasonality was stronger as seen in this light-blue line. The HUI averaged incredible 27.2% annual gains over the 17 gold-bull years prior to 2021! That’s why contrarian traders are willing to tolerate this sector’s big volatility.
When gold is really running, gold miners’ big inherent profits leverage to it help drive far-larger outsized gains. The last example was in spring 2020, which proved exceptionally-extreme due to that pandemic-lockdown stock panic. From mid-March to late May, GDX skyrocketed an astonishing 95.8% higher on a parallel massive 18.7% gold surge! That won’t happen this spring, but gold-stock gains should still be ample.
As always their fortunes depend on gold’s. If gold doubles its usual spring strength to power 8% higher on all those bullish drivers, GDX should amplify that upside by 2x to 3x. That implies 16% to 24% gold-stock gains, much better than their gold-bull average. But if Fed rate hikes and quantitative tightening hammer these lofty stock markets hard enough, gold’s spring gains could grow larger boosting gold stocks’.
A strong mean-reversion component could come into play too. Gold stocks’ recent technical basing has left them really out of favor. Midweek, GDX was trading at just 108.4 in seasonally-indexed terms. Just to mean revert to their average early-June indexed topping of 116.9, GDX would have to rally 7.8% from here. And since mean reversions tend to see opposing proportional overshoots, gold stocks could double that.
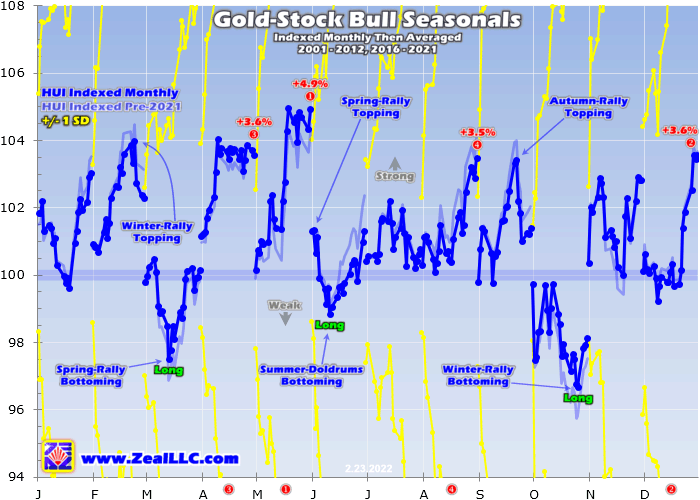
Gold stocks’ strong spring seasonals are also apparent at a finer monthly scale. From 2001 to 2012 and 2016 to 2021, the HUI averaged weak 0.1% gains in March, big 3.6% surges in April, and massive 4.9% catapultings in May before spring rallies peter out to 1.3% average June gains. April and May together form gold stocks’ strongest seasonal streak of the year, ranking third and first out of all the calendar months!
That’s clear in this next chart, which slices gold-stock seasonals into calendar months instead of years. This uses the same methodology discussed above, but applied to months rather than years. Each calendar month is individually indexed to 100 as of the previous month’s final close, then all like-months’ indexes are averaged together. This more-granular analysis confirms spring is the best time to own gold stocks.

After gold stocks’ post-winter-rally seasonal slump bottoms in mid-March, this sector tends to blast nearly straight higher until early June. No other two-calendar-month span comes close to the average upside the gold stocks have achieved in April and May. That optimistic spring psychology that affects broader stock markets has proven particularly influential over the gold stocks. Traders love this sector this time of year!
Still seasonality is merely a secondary driver, tendencies that provide tailwinds or headwinds to gold stocks’ primary drivers of sentiment, technicals, and fundamentals. So if popular greed reigned in gold stocks and had just driven them up to very-overbought levels without supporting earnings jumps, GDX would face a correction despite spring seasonals. But the polar opposite is true heading into this spring 2022.
Battered for over eight months now by periodic bouts of heavy-to-extreme gold-futures selling on irrational Fed-tightening fears, the gold stocks are seriously out of favor. This poor sentiment has been fueled by them falling then grinding sideways near lows for most of that span since Fed-rate-hike fears initially flared in mid-June. That has left this sector deeply-undervalued fundamentally, trading at dirt-cheap valuations.
In recent months plenty of gold stocks have been sporting incredibly-low trailing-twelve-month price-to-earnings ratios in the teens and even single-digits! Their low stock prices don’t reflect them earning money hand-over-fist with these high prevailing gold prices. So gold stocks’ very-bullish sentiment, technicals, and fundamentals are closely aligned for this coming spring rally. Its seasonal tailwind should boost upside.
Leading into this seasonally-strongest span of the year is a great time to get deployed in fundamentally-superior mid-tier and junior gold miners. With better output growth and lower market capitalizations, their stock-price gains as gold powers higher well-outperform the GDX majors. Our newsletter trading books are full of these high-potential gold stocks. The earlier traders get deployed, the more upside they can ride.
The bottom line is gold stocks often experience a strong spring rally seasonally. This is driven by gold’s own seasonality, where outsized investment demand arises at certain times during the calendar year. Gold usually enjoys a solid spring rally likely fueled by the universal optimism this season brings. And since gold drives gold miners’ profitability, their stock prices naturally follow it higher and amplify its gains.
That infectious spring exuberance has proven exceptionally-potent for gold stocks. This time of year their gold outperformance far exceeds that seen in their autumn and winter rallies. This sector’s spring rally is its strongest of the year seasonally. And 2022’s has excellent potential to grow much larger than normal. Gold stocks should surge dramatically, leveraging big gold gains on raging inflation and rolling-over stock markets.
(By Adam Hamilton)
{{ commodity.name }}
{{ post.title }}
{{ post.date }}


Comments