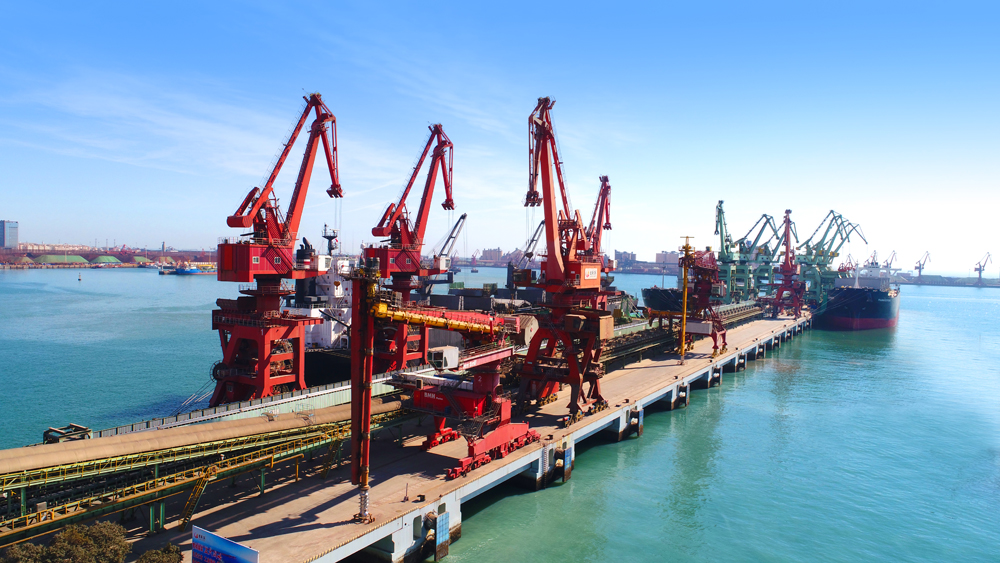
Column: China’s commodity import trend driven by prices, not economy

China’s imports of major commodities are often viewed through the prism of the performance of, and outlook for, the world’s second-biggest economy.
But it’s probably more important to look at price trends when assessing the world’s biggest commodity importer’s inbound shipments of crude oil, liquefied natural gas (LNG), copper, iron ore and coal.
The diverging fortunes of imports of these commodities in the first half of 2024 align more closely with price movements than it does with economic performance.
This is especially the case for iron ore, the key raw material used to make steel, and a commodity that on the surface should have struggled given China’s well-documented, ongoing struggles to boost its ailing property sector.
Instead, iron ore imports have risen a robust 6.8% in the first half compared to the same period in 2023, reaching 611.18 million metric tons, up 35.05 million from the first half last year.
The rise in imports hasn’t been used to make much more steel, rather it’s been used to rebuild inventories.
Data from consultancy SteelHome shows port stockpiles have risen 35.7 million tons from the end of December to the two-year high of 150.2 million in the week to July 12.
It’s no coincidence that the gain in inventories almost exactly matches the increase in imports, but the question remains as to why China’s iron ore traders and steel mills have chosen to lift stockpiles at a time of uncertainty for steel demand.
The answer lies in the price, with Singapore Exchange contracts spending the first quarter of 2024 trending weaker, before consolidating at lower levels in the second quarter.
Iron ore contracts reached $143.08 a ton on Jan. 3 – its highest level so far this year – before sliding to the low of $98.36 on April 4.
Since then, the price has moved in a relatively narrow band and ended at $107.48 a ton on Wednesday.
In contrast to iron ore, crude oil imports have been weak, defying predictions from industry groups including the Organization of the Petroleum Exporting Countries (OPEC) and the International Energy Agency that strong Chinese demand will lead global growth this year.
The world’s top crude importer saw arrivals of 11.05 million barrels per day (bpd) in the first half of 2024, down 2.9% from the 11.38 million bpd over the same period last year.
The decline in crude imports came amid a rising price trend, with global benchmark Brent futures rising from $77.05 a barrel at the end of December to a high of $92.18 on April 12, as OPEC and its allies in the OPEC+ group deepened output cuts.
Since the April high, Brent trended weaker to a low of $78.09 a barrel on June 3, but has since recovered to end at $85.08 on Wednesday.
The decline in China’s oil imports also stands in contrast to the rise in natural gas imports, both via pipeline and as LNG.
Total natural gas imports jumped 14.3% to 64.65 million tons, according to customs data, with much of the increase coming from LNG, given pipeline capacity constraints.
The rise in LNG imports came as the spot price of the fuel for delivery to north Asia fell sharply from the fourth quarter of 2023, before stabilizing at lower levels.
The price dropped from a high of $17.90 per million British thermal units (mmBtu) to a low of $8.30 on March 1.
It has then staged a rally to end at $12.10 per mmBtu in the week to July 12, however, there are already signs that the recent rise in prices is starting to crimp demand.
Natural gas imports were 10.43 million tons in June, down 7.9% from May’s 11.33 million, according to customs data.
COPPER, COAL
Copper imports also show a relationship to price, having increased when prices were modest and declined after they rose.
Imports of unwrought copper rose 6.8% in the first half of 2024 to 2.763 million tons, which seems a relatively strong performance.
But what’s worth noting is that June’s imports were 436,000 tons, down 15.2% from May’s 514,000 and the weakest since February.
The weak June imports came after global benchmark London copper prices climbed to a record high of $11,104.50 a ton on May 20.
The price spent the first quarter in a relatively narrow range anchored around $8,300 a ton before surging to the May high.
Given the lag between price movements and the physical arrival of cargoes, it appears that Chinese copper buyers lifted imports during the period of modest prices, but have pulled back since the strong rally to the May high.
The final major commodity showing a correlation to prices is coal, with China’s imports rising a strong 12.5% in the first half to 249.57 million tons.
While strong power demand and struggling domestic output have boosted import demand, it’s worth noting that seaborne thermal coal prices have been trending weaker.
Indonesian coal with an energy content of 4,200 kilocalories per kilogram , a grade popular with Chinese utilities, ended at $52.70 a ton in the week to July 12, down 9.2% so far this year, according to assessments by commodity price reporting agency Argus.
The overall message from China’s commodity imports is that price is likely the most important driver of volumes, with economic conditions a secondary factor.
(The opinions expressed here are those of the author, Clyde Russell, a columnist for Reuters.)
(Editing by Miral Fahmy)
{{ commodity.name }}
{{ post.title }}
{{ post.date }}


Comments