Charted: Commodities vs equity valuations (1970–2023)

Charted: Commodities vs equity valuations (1970–2023)
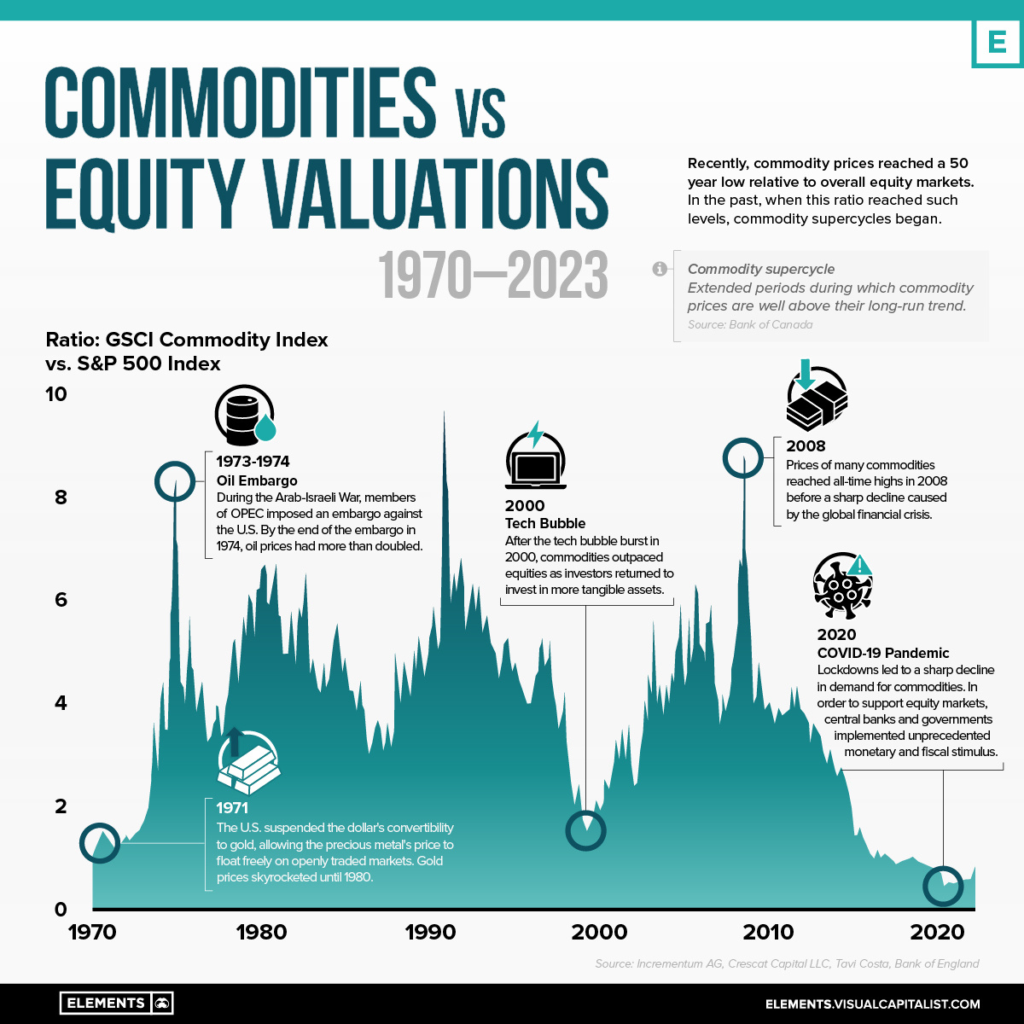
In recent years, commodity prices have reached a 50-year low relative to overall equity markets (S&P 500). Historically, lows in the ratio of commodities to equities have corresponded with the beginning of new commodity supercycles.
The infographic above uses data from Incrementum AG and Crescat Capital LLC to show the relationship between commodities and U.S. equities over the last five decades.
What is a commodity supercycle?
A commodity supercycle occurs when prices of commodities rise above their long-term averages for long periods of time, even decades. Once the supply has adequately grown to meet demand, the cycle enters a downswing.
The last commodity supercycle started in 1996 and peaked in 2011, driven by raw material demand from rapid industrialization taking place in Brazil, India, Russia, and China.

While no two supercycles look the same, they all have three indicators in common: a surge in supply, a surge in demand, and a surge in price.
In general, commodity prices and equity valuations tend to have a low to negative correlation, making it rare to see the two moving in tandem in the same direction for any long period of time.
Commodity prices and equity valuations
In line with the above notion, commodity prices and equity valuations have often been at odds with one another in past market cycles.
During the 1970s and early 1980s, for example, rising oil prices led to a significant decline in stock prices as higher energy costs hurt corporate profits. In contrast, during the first half of the 2000s, low oil prices were accompanied by a strong equity bull market that ended with the 2008 stock market crash.
The relationship, however, is not always straightforward and can be affected by various other factors, such as global economic growth, supply and demand, inflation, and other market events.
With the most recent commodity supercycle peaking in 2011, could the next big one be right around the corner?
{{ commodity.name }}
{{ post.title }}
{{ post.date }}


Comments