Productivity misconceptions
In the media warm-up for Wednesday’s UK budget, we were told of Britain’s poor productivity and Chancellor Osborne subsequently confirmed that his priority is to address it. Comparative figures for Europe quoted by the BBC were sourced from the OECD and are replicated in the chart below.

It represents GDP per hour worked, using the US dollar on a purchasing power parity basis across different EU nations. And it shows the UK as lagging other European countries badly, which presumably is why the Chancellor feels the need to act.
These statistics are misleading. France is shown as even more productive than Germany, which cannot be true. France’s unemployment is at 12% and private sector employment is only 62% of the OECD’s “economically active population”. This is not a productive economy. Furthermore the public sector is 57% of GDP, compared with 44% for the UK.
Trying to measure average hourly productivity the OECD way is simplistic and based on assumptions. The formula is GDP divided by total hours worked, so we are being asked to take GDP for granted, when it is in fact an incomplete summation of production value. And in GDP there is no distinction between product commanded onto the market by government and goods and services freely demanded by consumers. And we cannot know hours worked because very few businesses today clock employees in and work out beverage, comfort and lunch breaks.
We can construct a better and more relevant productivity indicator, based on the cost of employment, which is not addressed by the OECD approach. Government, which is an economic cost, should be eliminated from all estimates of production by removing the sector from GDP entirely to isolate the part we actually want, the private sector. The private sector’s costs in supporting the state, the taxes that fund unproductive government spending, should also be removed from private sector GDP. And because we produce to consume, this means as proxy for the cost of government subtracting all taxation from private sector GDP, whether it is on production or consumption.
Next, only the employed and self-employed in the private sector should be included in the divisor by eliminating public sector workers and the unemployed. The result of all these changes produces a very different result, shown in the chart below.
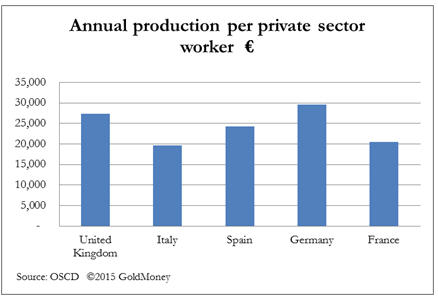
This information is not only more relevant than the OECD’s misleading estimate of productivity, but it is more useful for international businesses interested in the relative costs of employment.
We should take this one step further and consider the position from our statistically averaged employee. The following table shows the estimated net income of an employee whose cost of employment to an employer is equal to the national average production per private sector worker as shown in the revised chart above.

We now have a new perspective on the subject of productivity. In order to match the high productivity rates shown in the OECD’s productivity statistics, a French worker takes home only €834 per month, and the Italian not much more. For them there’s little point in working. However, the Brit’s take-home pay is more than any of the others, including that of the average German employee.
What this exposes is that the principal determinant of productivity is not the relative skill and dedication of workers as suggested by the OECD’s figures, but the cost of employment. An employer after paying employment and income taxes can less easily afford to pay a living wage in France and Italy. It seems bizarre that official indicators of productivity ignore employment costs, which is after all far more relevant to prospective employers.
Let us hope someone draws this to George Osborne’s attention.
An article by GoldMoney’s Head of Research, Alasdair Macleod
Disclaimer: The views and opinions expressed in the article are those of the author and do not necessarily reflect those of GoldMoney, unless expressly stated. Please note that neither GoldMoney nor any of its representatives provide financial, legal, tax, investment or other advice. Such advice should be sought form an independent regulated person or body who is suitably qualified to do so. Any information provided in this article is provided solely as general market commentary and does not constitute advice. GoldMoney will not accept liability for any loss or damage, which may arise directly or indirectly from your use of or reliance on such information.
GoldMoney
GoldMoney is one of the world’s leading providers of physical gold, silver, platinum and palladium for private and corporate customers, allowing users to buy precious metals online. The easy to use website makes investing in gold and other precious metals accessible 24/7.
Through GoldMoney’s non-bank vault operators, physical precious metals can be stored worldwide, outside of the banking system in the UK, Switzerland, Hong Kong, Singapore and Canada. GoldMoney partners with Brink’s, Loomis International (formerly Via Mat), Malca-Amit, G4S and Rhenus Logistics. Storage fees are highly competitive and there is also the option of having metal delivered.
GoldMoney currently has over 20,000 customers worldwide and holds over $1billion of precious metals in its partner vaults.
GoldMoney is regulated by the Jersey Financial Services Commission and complies with Jersey’s anti-money laundering laws and regulations. GoldMoney has established industry-leading governance policies and procedures to protect customers’ assets with independent audit reporting every 3 months by two leading audit firms.
Further information:
Visit: Goldmoney.com or view our video online

{{ commodity.name }}
{{ post.title }}
{{ post.date }}


Comments