Mining equipment market continues recovery/expansion in third quarter 2017
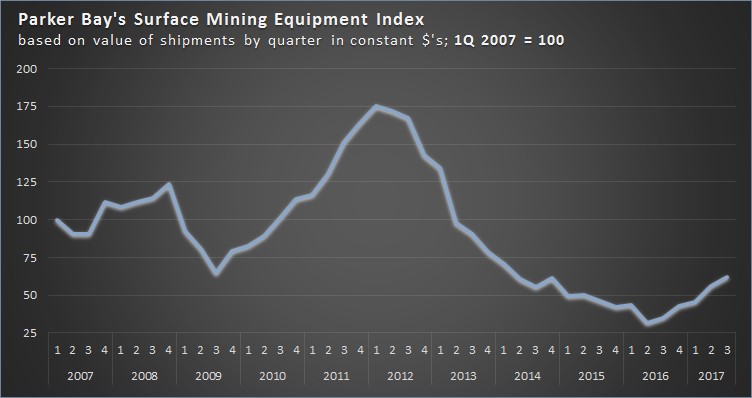
As measured by The Parker Bay Company’s accounting of large surface mining equipment shipped worldwide, the latest deliveries to mines moreincreased by more than 10%. Those gains come on top of very strong increases in the previous quarter and bring these equipment markets to nearly double that of the cyclical bottom reached in Q2 2016. As measured by Parker Bay’s Surface Mining Equipment Index®, the dollar-weighted shipments reached 62.3 (Q1 2007 = 100). While a very substantial rebound from the depths of the last cyclical contraction, the value of deliveries worldwide remains more than 60% below the peak level achieved in Q1 2012.
These deliveries continue the trend that started in the third quarter of 2016 and reinforce the many other indications of a sustained and growing recovery and expansion of mining and equipment markets worldwide. Although not every market segment expanded during Q3, the overall market increased by approximately 11% over Q2. And when comparing these latest shipments to those of a year ago, the gain is an impressive 83% (number of units). Mining trucks, by far the largest product sector, increased by nearly 20%, surpassing 600 unit deliveries for first time since Q2 2013. The gains recorded by manufacturers of excavators/loaders were even greater during Q3 (+43%) after lagging behind truck shipments during earlier stages of this expansion phase. But in contrast, crawler and wheel dozer shipments lagged these primary production products with shipments contracting by 17% vs. Q2 and up just 6% year-over-year. This latest result may be anomalous and could represent a more pressing need for miners to focus their still restrained capex on those products essential to maintaining and growing mineral output. And miners may be turning to used equipment markets to fulfill dozing requirements short-term. We expect a recovery and acceleration in dozer deliveries in the near future.
| Large Surface Mining Equipment Shipments by Product Line | ||||||||||
| <——-2016——> | <——2017——> | % Δ | % Δ | |||||||
| Q2 | Q3 | Q4 | Q1 | Q2 | Q3 | Q3/Q2 | YoY | |||
| Total* | 388 | 446 | 563 | 617 | 736 | 818 | 11% | 83% | ||
| Mining Trucks | 229 | 274 | 404 | 406 | 514 | 611 | 19% | 123% | ||
| Excavating/Loading Equipment | 68 | 66 | 78 | 69 | 72 | 103 | 43% | 56% | ||
| Hydraulic Shovels/Excavators | 39 | 40 | 48 | 46 | 49 | 66 | 35% | 65% | ||
| Wheel Loaders | 26 | 23 | 29 | 22 | 21 | 36 | 71% | 57% | ||
| Electric/Rope Shovels | 3 | 3 | 1 | 1 | 2 | 1 | -50% | -67% | ||
| Dozers, Crawler & Wheel | 76 | 95 | 76 | 112 | 122 | 101 | -17% | 6% | ||
| * Product listings do not add to Total due to reporting & non-disclosure consideration. | ||||||||||
Within these product groups, the average size of machines delivered continued to decline, a trend that has marked the current recovery. The value of machines shipped increased by a somewhat slower pace than unit shipments, this despite the low growth in lower-priced dozers. As further evidence of this shift to smaller machines, average truck payload was just 136 mt vs. 149 mt for Q2 and 170-mt+ during the peak years 2012-2013. While increases in ‘ultra class’ truck shipments have been significant, they have lagged behind increases in delivery of smaller trucks especially those in the 90-110 mt range. This likely reflects an overall need to replace these smaller trucks. But it is also a reflection of shifts in geographic markets to regions where miners rely on trucks in these smaller size classes.
Mines in Russia/CIS, India and Indonesia continue to pace the current expansion. Deliveries to miners in Russia/CIS more than doubled year-over-year and these have now been outpaced by equipment buyers in Australasia with Indonesian miners and contractors far ahead of their counterparts in Australia. Changes in other regions varied from +288% in Europe, Middle East to -14% in North America. But these figures point out that quarter-to-quarter variations may not reflect longer-term trends. For example, the very sharp gains in Europe, Middle East reflect the small numbers of units required in a region in secular decline. Nevertheless, there does appear to be a continuing and significant dichotomy between faster growth in equipment demand from Russia/CIS, Africa and parts of Australasia, and slower recovery of shipments to the mature regions dominated by the largest world-class mines – North America, Latin America, Australia. At some point in this expansion we expect the largest miners in these regions to switch from restrained to more expansive capex (including several potentially large ‘greenfield’ developments) and attendant equipment buying. But that is not yet reflected in shipments to date.
| Large Surface Mining Equipment Shipments by Geographic Region | |||||||||||
| <——–2016——–> | <——-2017——-> | % Δ | % Δ | ||||||||
| Q2 | Q3 | Q4 | Q1 | Q2 | Q3 | Q3/Q2 | YoY | ||||
| Total* | 388 | 446 | 563 | 617 | 740 | 818 | 11% | 83% | |||
| Africa | 66 | 56 | 44 | 85 | 76 | 95 | 25% | 70% | |||
| Asia | 28 | 79 | 58 | 104 | 72 | 70 | -3% | -11% | |||
| Australasia | 83 | 98 | 132 | 134 | 200 | 222 | 11% | 127% | |||
| Europe, Middle East | 14 | 6 | 57 | 25 | 8 | 31 | 288% | 417% | |||
| Latin America | 34 | 40 | 26 | 44 | 59 | 46 | -22% | 15% | |||
| North America | 67 | 29 | 67 | 39 | 87 | 75 | -14% | 159% | |||
| Russia, CIS | 94 | 138 | 179 | 186 | 238 | 279 | 17% | 102% | |||
The distribution of shipments by mineral market continues to reflect a somewhat unexpected strength in buying by coal miners in select national markets. Coal mines accounted for nearly half of all unit shipments in Q3, down moderately from the peak levels achieved in the second half of 2016 but well about historical norms. A substantial majority of these machines were placed in service in Russia, Indonesia and India, while coal operators in the very large surface coal producing countries that dominated during the expansion phase – Australia, the U.S., Canada and South Africa – remained largely on the ‘sidelines’. In time, these sectors of the coal industry will likely ratchet up capex and equipment purchases but, owing to economic and political constraints, perhaps not to the levels that existed before the last contraction.
The three major metals – copper, gold and iron – increased their share of shipments to nearly 40% of Q3 totals with copper mines in particular surging vs. Q2. This likely reflects the need to offset the extended postponement of inevitable replacement demand as well as a recognition of the improving supply/demand balance globally. Mines like First Quantum’s new Minera Panama may drive copper mining equipment demand going forward.
Increased demand from iron ore mines likewise reflects improving market conditions and a growing necessity to replace aging equipment. But the location of the latest buying does not reflect the oft-talked about surge in autonomous-operating haulers. Very few were shipped in Q3. Moreover, fewer than one-third of deliveries to iron ore mines went to the dominant producing countries, Australia and Brazil, while more than half of shipments went to iron mines in Russia/CIS. Given the announced increasing capex plans by the largest Australian and Brazilian producers, these shares are judged to be anomalous and likely to revert to more traditional demand patterns in the near future.
Gold mines accounted for 13% of all units shipped in Q3 with demand coming from a dozen countries and stemming from both replacement at existing operations and the opening of new ones. Moving in the opposite direction, oil sands mines substantially reduced new machine commissioning in Q3. But given the small number of mines, this figure is not likely to represent a longer-term trend as several of these operations have committed to substantial numbers of truck replacements with autonomous-drive units expected in the year ahead.
| Large Surface Mining Equipment Shipments by Market Share by Mineral * | ||||||
| <————–2016————-> | <————-2017————-> | |||||
| Q2 | Q3 | Q4 | Q1 | Q2 | Q3 | |
| Coal | 32% | 51% | 59% | 55% | 49% | 49% |
| Copper | 9% | 6% | 5% | 8% | 8% | 14% |
| Gold | 21% | 9% | 13% | 15% | 12% | 13% |
| Iron | 9% | 12% | 7% | 9% | 10% | 12% |
| Oil Sands | 5% | 1% | 5% | 2% | 10% | 4% |
| Others | 24% | 22% | 12% | 11% | 11% | 9% |
| * Excludes units identified by contractor, lease/rental, or corporate location only. | ||||||
The overriding attribute of this overview of Q3 shipments is one of optimism. The mineral and equipment market conditions that have evolved over the past 12-18 months and led miners to increase their purchases of new machines are still in place and expected to continue for the next year, and likely longer. Current demand remains sufficiently below the levels obtained at the 2012 peak such that further growth appears very likely, and fully warranted by mineral supply/demand conditions in nearly all product, geographic, and mineral sectors.
Interested parties are encouraged to contact Parker Bay at [email protected] or by visiting the Company website www.parkerbaymining.com. Additional details on the Surface Mining Equipment Index are available at: http://parkerbaymining.com/industry-information/surface-mining-equipment-index.htm
More News
{{ commodity.name }}
{{ post.title }}
{{ post.date }}


Comments