Mapped: Foreign direct Investment by country

For many of the world’s companies, the best investment opportunities aren’t always located within their own domestic borders.
Whether it is building a new Starbucks store in Abu Dhabi or Tata Motors acquiring Land Rover, foreign direct investment (FDI) is a measure of how much business capital is flowing in and out of countries.
In 2017, total foreign direct investment was $1.43 trillion globally, and today’s map from HowMuch.net breaks down where this money went by country.
The countries getting FDI
The following data comes from a recent report by the United Nations Conference on Trade and Development.
At a high level, here is where foreign direct investment flows went, based on the type of economy:
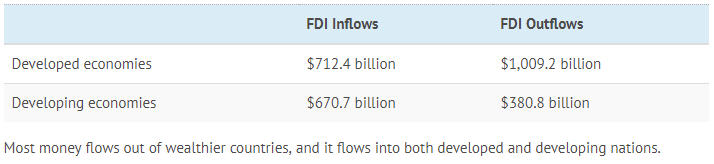
Foreign direct investment is often considered a win-win that brings new capital and jobs to developing nations, while simultaneously creating opportunities for corporations and investors.
Now, let’s look at the top 15 countries and jurisdictions receiving FDI inflows:
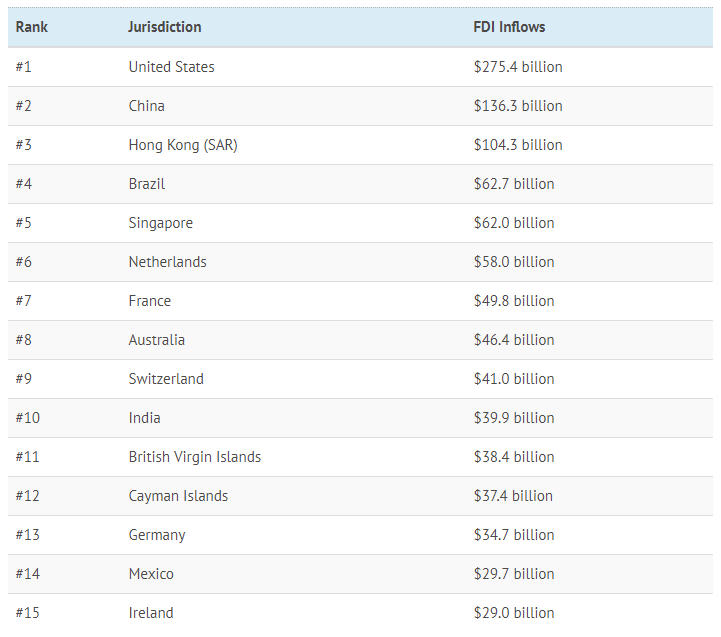
At the top of the list are the United States ($275.4 billion) as well as China and Hong Kong ($240.6 billion), which is not surprising to see.
Further down the list, things become more interesting. Tax havens such as the British Virgin Islands and the Cayman Islands rank higher than developed economies like Canada, United Kingdom, and Japan, which don’t even come close to cracking the top 15.
Meanwhile, Brazil’s ranking in fourth place is also quite impressive with $62.7 billion of foreign direct investment inflows in 2017 – this is not a one-time thing either, since the economy had $58 billion of inflows in 2016 as well.
{{ commodity.name }}
{{ post.title }}
{{ post.date }}


Comments