This leading indicator looks bullish for gold

There are more than a handful of things I can cite as leading indicators for the Gold price.
Ratios such as Gold against the stock market and Gold against foreign currencies are generally good leading indicators. The gold stocks and Silver can function as leading indicators at times.
The yield curve and bonds can also be leading indicators.
But there is one thing I’ve never mentioned, nor written about. It makes sense in the current context though. That’s Platinum.
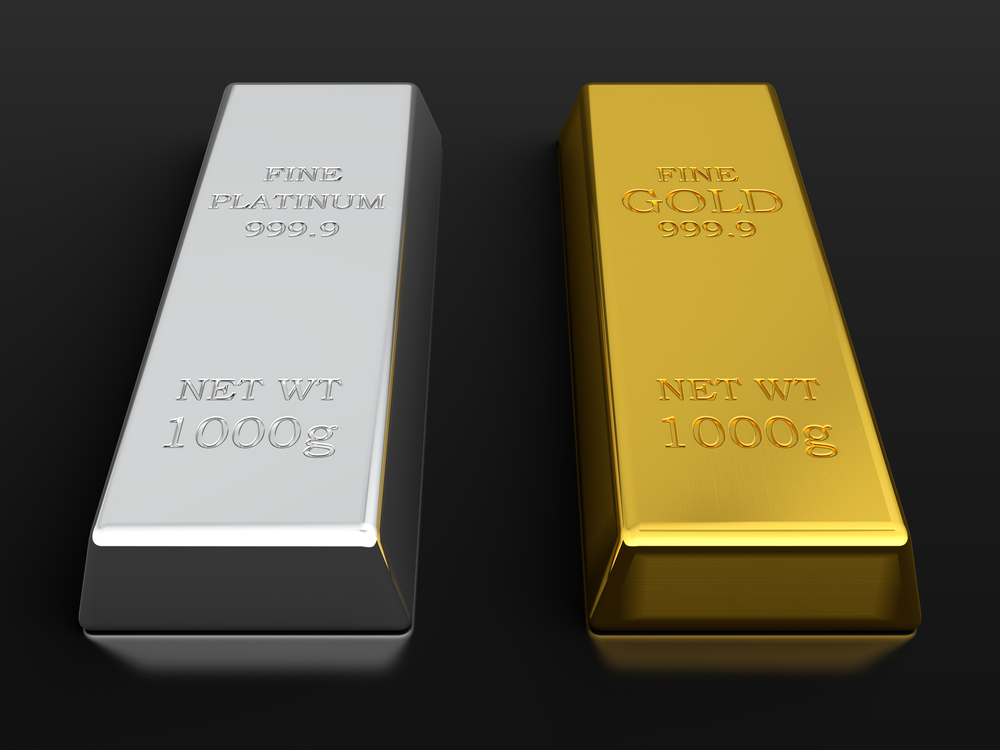
Platinum has a brief but clear history as a leading indicator for Gold.
Platinum outperformed and led Gold higher immediately after the two most recent major lows: 1985 and 1999-2001.

We also want to note the 1966-1968 period when Platinum tripled in price. Silver doubled and Gold of course was still fixed in price. In any event, Platinum’s huge move in the late 1960s was a leading indicator for Gold’s forthcoming surge.
Since the February highs Platinum has made a higher high while Gold has corrected. Platinum looks like it has a reasonable shot to make a new 52-week high this year while Gold would need to fight through the wall of resistance to make a new 52-week high.

According to BMG Group, a study by Wainright Economics showed that Platinum is the leading indicator of inflation. While Gold and Silver lead by a year, Platinum leads by 16 months.
Whatever the reason, history is clear. Around major bottoms in precious metals, Platinum tends to outperform and lead Gold. Since February Platinum has strongly outperformed Gold while registering an important positive divergence.
We will certainly keep abreast of the other leading indicators such as relative performance of the miners, Fed policy, a steepening yield curve and precious metals performance against the stock market. We will also keep an eye on Platinum as continued outperformance would be a strongly bullish signal for Gold for 2020 and beyond.
The weeks and months ahead should continue to be an especially opportune time to position yourself in this sector.
(By Jordan Roy-Byrne)
{{ commodity.name }}
{{ post.title }}
{{ post.date }}


Comments