How low can gold go? The gold shakeout continues, stay the course!
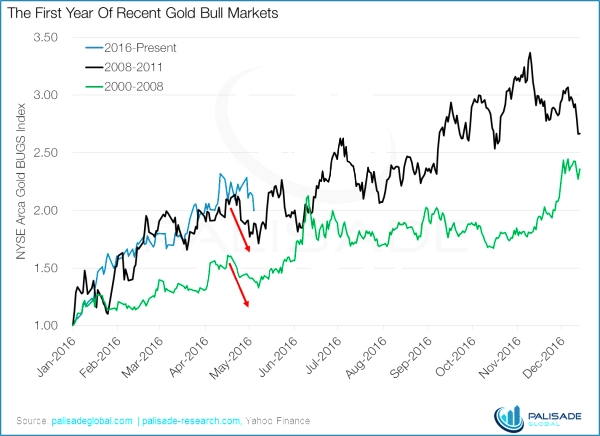
Last week we put out a chart that may have scared some investors. We stated that a gold pullback was imminent and we could expect the Gold BUGS Index to lose another 14% in gold miners before markets stabilize. In just three days, we have lost another 3% – this rapid decline is unprecedented as investors were already hesitant about golds enormous rally.
The pullback coincides almost perfectly with the Feds expected increase in interest rates, signaling a deteriorating labour market in the US. This will likely exert upward pressure on inflation, reinforcing the case for higher rates.
But we will be maintaining the course. This pullback is healthy and expected and every gold bull market in the past has experienced this sort of oscillation. The fact that we just exited one of the longest bear markets means we may be in for one of the longest and most substantial bulls ever. Let’s revisit this bull analog chart we have published before, with the help from our good friend Jordan Roy-Byrne from www.thedailygold.com.
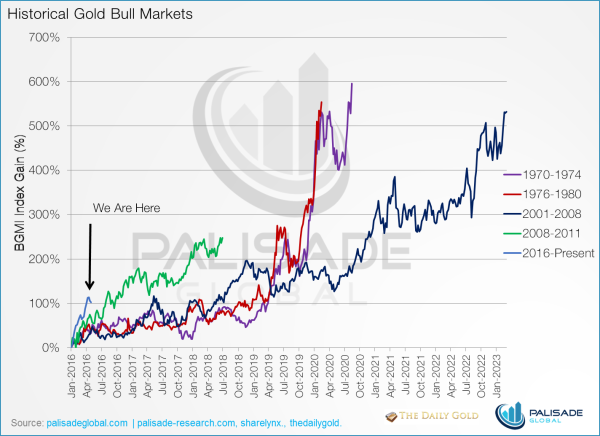
The current pullback is minute compared to ones experienced in full-fledged bull markets. And as we mentioned previously, selling now to avoid a possible 10% decline seems like a risky bet. We would rather hold for the long-term; using the 2001-2008 gold bull as proxy, this rally can last until 2023.
Believe in the thesis and do not get shaken out.

{{ commodity.name }}
{{ post.title }}
{{ post.date }}


Comments