Gold on sale, says the rational investor
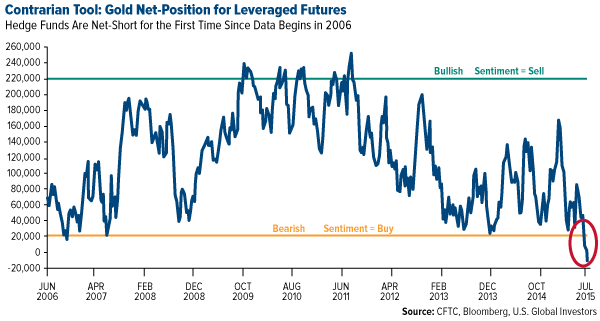
 The leveraged gold futures derivatives market is knocking down the precious metal, yet in massive contrast, this drop has ignited a shopping frenzy according to gold coin dealers. I spoke with several friends and industry experts last week who confirmed the record sales numbers for the month. In fact, American Gold Eagle sales reached 161,500 ounces in July, the highest monthly figure since April 2013. What gives?
Gold often attracts conspiracy theories when it falls so abruptly, especially on Mondays. Interestingly, in a recent article on Zero Hedge, ABC Bullion out of Sydney, Australia, details some of the speculation behind the precious metal’s beatdown, which I’ve also discussed in my blog.
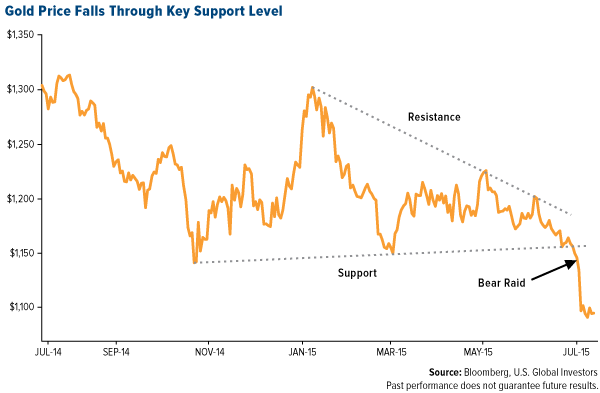
Price manipulation, or a “bear raid,” could be a factor. Last week, gold prices experienced a mini “flash crash”—the first one in 18 months—after five tonnes of the metal appeared on the Shanghai market. Whether front-running or fat fingers are to blame, the sell order for what many are calling a bear raid was initially thought to have originated in China, but we now believe it came from New York City.
Did investors anticipate China’s negative flash purchasing managers’ index (PMI) last week? China is the largest consumer of gold, and the PMI is a useful leading indicator of commodities demand as well as job growth.
What about the Greek crisis? This type of debt fear crisis often has the effect of boosting the price of gold, but we didn’t see that happen. Did European central banks sell gold down to dampen the psychological impact of the event? Understating the seriousness of the debt crisis may have prevented investors from seeking gold as protection.
Conspiracy theories or not, I believe none of this tarnishes gold’s sustainable allure. It’s important to look at the two key demand drivers for gold: the Fear Trade and the Love Trade. The Fear Trade is related to money supply and negative real interest rates. The Love Trade comes from the purchase of gold due to cultural affinity and the rising GDP per capita in Asia and the Middle East.
I’ve always advocated, and continue to advocate, a 10 percent weighting: 5 percent in gold stocks and 5 percent in bullion, then rebalance every year.
From Crisis to Opportunity
Take a look at the chart, which shows that the bearish trend is obvious.
And yet many investors are still buying. In an interview this week with Money Metals Exchange and in talking to Bart Kitner, founder of Kitco, both conversations confirmed that smart investors are enthusiastically buying gold during this downdraft in prices.
Rational Investors Know a Deal When They See One, and Feel One
With so much gloom and doom in the media surrounding gold right now, you might wonder why coin sales are soaring at multiyear highs. The reason is pretty simple: Gold is on sale.
 |
High net worth individuals and other savvy investors realize that even now, as herds of people are rushing for the exit, owning gold is one of the best ways to manage systemic risk. They follow that Greeks had their cash in banks frozen like in Cyprus only a few years ago.
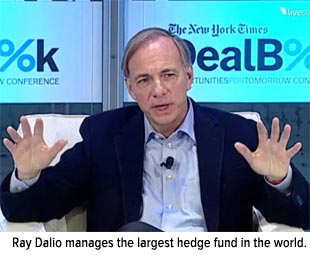
Ray Dalio, founder of Bridgewater Associates, said it best: “If you don’t own gold, you know neither history nor economics.”
Indeed, some investors fail to take a long-term perspective on gold. Their sentiment toward the metal extends only as far back as the most recent selloff, induced by the strong U.S. dollar, weak global manufacturing activity and fears that interest rates will soon rise.
Many investors have that “sinking feeling” with a deterioration in global PMI, leading economic indicators, falling commodity prices and the threat of rising U.S. interest rates. Many have raised their cash levels due to decelerating global growth prospects. I’ve written that bad news is good news because when governments accelerate monetary policy, this can be a good opportunity for investors to add to their gold exposure.
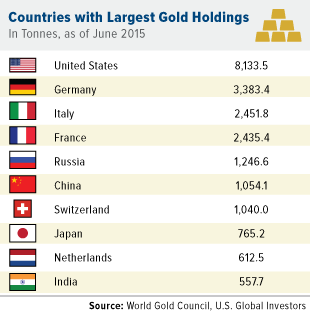 |
I’m not the only one who takes this position. Besides the investors gobbling up American Gold Eagles, central banks around the world continue to buy, hold and repatriate bullion. The U.S. Federal Reserve maintains its 8,133 tonnes, the most of any central bank. Germany, the Netherlands and other countries have brought home mounds of the yellow metal in the last 12 months. China has increased its reserves 60 percent in the last six years. And Texas is in the early stages of establishing its own gold depository, the first state to do so. If there were no faith left in the metal, why would banks even bother with it?
At the same time, massive amounts of paper money are still being printed. In fact, the International Monetary Fund has asked the Bank of Japan to be ready to increase its monetary stimulus further, according to Bloomberg. Let the paper printing roll! In the U.S., where quantitative easing was supposed to have ended back in October, the Fed’s balance sheet is still within 0.3 percent of its all-time high, according to Sovereign Man.
Based on Historical Volatility Models Gold Is Extremely Oversold
Before the bottom fell out, gold’s support seemed to have been around $1,150, whereas the resistance trend line was breaking down. The descending triangle pattern, seen below, indicates that demand was weakening and downside momentum was gathering force.
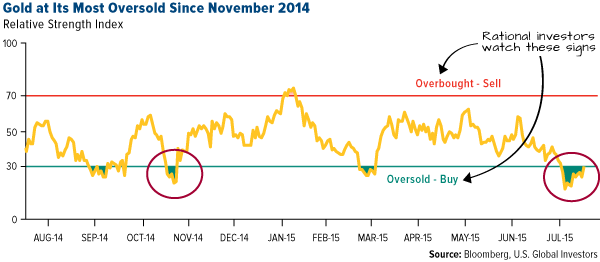
A useful tool that traders and analysts use is Bloomberg’s relative strength indicator (RSI). Below is gold’s RSI over the same one-year period. It shows that gold has passed below the 30 mark into oversold territory. When this happens, many analysts see it as a buying opportunity. Between November 3—the last time gold fell this significantly below 30—and January 20, the yellow metal ended up rallying 13 percent.
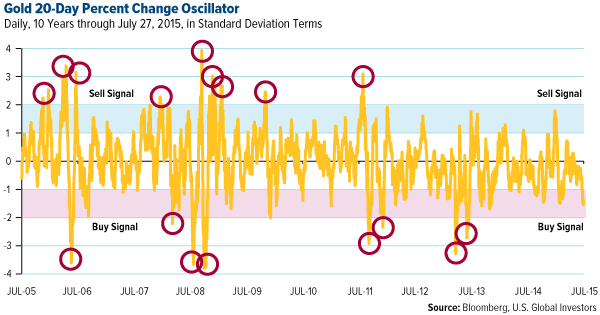
A similar tool we use to identify buy and sell signals is the price oscillator, which I often explain while speaking at conferences. This tool measures how many standard deviations an asset’s value has moved from its mean (and in which direction). When the number crosses above two standard deviations, it’s often interpreted as an opportunity to take some profits, and when it crosses below negative two, it might be a good time to think about accumulating.
Love Trade and Fear Trade: Gold’s Tailwinds and Headwinds
I always look at two demand factors for gold, the Fear Trade and the Love Trade. The Love Trade is the purchase of gold for weddings, anniversaries and cultural celebrations while the Fear Trade is gold’s reaction to monetary and fiscal policies, particularly real interest rates.

Historically, the Love Trade has been on the upswing starting around this time—late July and early August—in anticipation of international festivals and holidays such as Diwali, Christmas and the Chinese New Year. But as you can see in the oscillator chart above, gold is down 1.4 standard deviations for the 10-year period. This suggests gold may be at an attractive level to accumulate, and gold stocks can offer greater beta when gold begins to revert to its mean.
The Fear Trade, on the other hand, involves the Fear Trade and real interest rates (inflation – CPI = real interest rates). Several times in the past I’ve explained how gold tends to benefit when real interest rates turn negative. When the rate of inflation exceeds the yield on a five-year Treasury note, it makes gold much more attractive to many investors.
At this time, the five-year Treasury yield sits at 1.58 percent while inflation is crawling along at 0.1 percent. This means that real rates are a positive 1.48 percent—a headwind for gold. As I told Daniela Cambone during last week’s Gold Game Film, the U.S. has some of the highest real rates of return in the world right now.
To see gold gain traction again, not only do we need to see negative real interest rates in the U.S. we need to see rising real GDP per capita in China and rising PMI in China.
On a final note, there appears to be a battle between the debt markets and equity markets. The debt market yields suggest rates will not be rising next month or quarter, while equity markets suggest they will. I think the bond market is more accurate. With a struggling global economy and commodity deflation odds favor rates will not rise soon in America, and gold will revert back to the mean.
Past performance does not guarantee future results. All opinions expressed and data provided are subject to change without notice. Some of these opinions may not be appropriate to every investor. By clicking the links above, you will be directed to third-party websites. U.S. Global Investors does not endorse all information supplied by these websites and is not responsible for their content.
The Relative Strength Index (RSI) is a technical indicator used in the analysis of financial markets. It is intended to chart the current and historical strength or weakness of a stock or market based on the closing prices of a recent trading period. The indicator should not be confused with relative strength.
Standard deviation is a measure of the dispersion of a set of data from its mean. The more spread apart the data, the higher the deviation. Standard deviation is also known as historical volatility.
M2 Money Supply is a broad measure of money supply that includes M1 in addition to all time-related deposits, savings deposits, and non-institutional money-market funds
Beta is a measure of the volatility, or systematic risk, of a security or a portfolio in comparison to the market as a whole.
The Purchasing Manager’s Index is an indicator of the economic health of the manufacturing sector. The PMI index is based on five major indicators: new orders, inventory levels, production, supplier deliveries and the employment environment.
The Consumer Price Index (CPI) is one of the most widely recognized price measures for tracking the price of a market basket of goods and services purchased by individuals. The weights of components are based on consumer spending patterns
{{ commodity.name }}
{{ post.title }}
{{ post.date }}


Comments