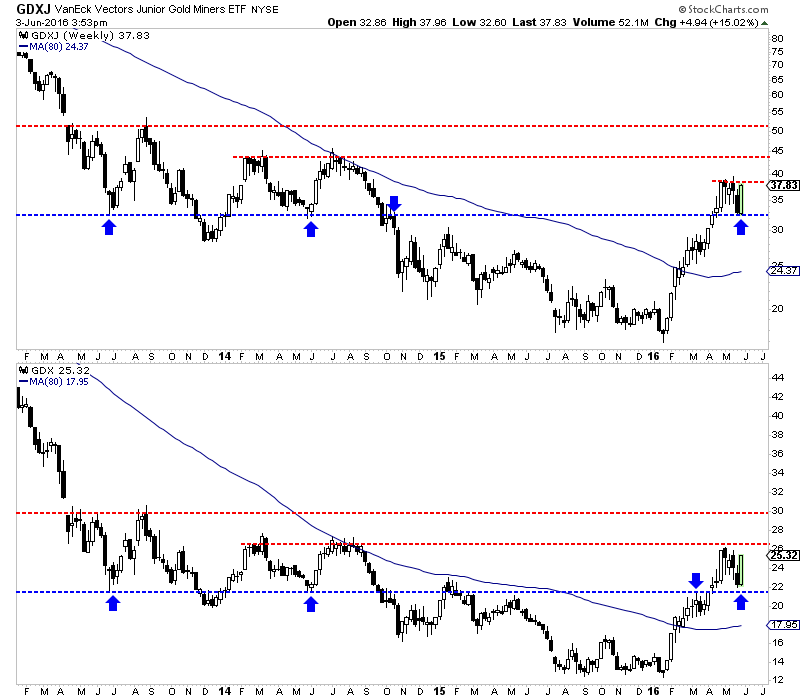
Below are the weekly candle charts for GDXJ and GDX which have now engulfed the bearish candle from the previous week. Note how the miners were able to hold support which includes the 50-day moving averages (not shown). If GDXJ can make a weekly close above $38 then that brings upside targets of $44 and $50 into play. Meanwhile, if GDX can make a weekly close above $26 then it has upside potential to $30 and even $32, the 38% retracement.

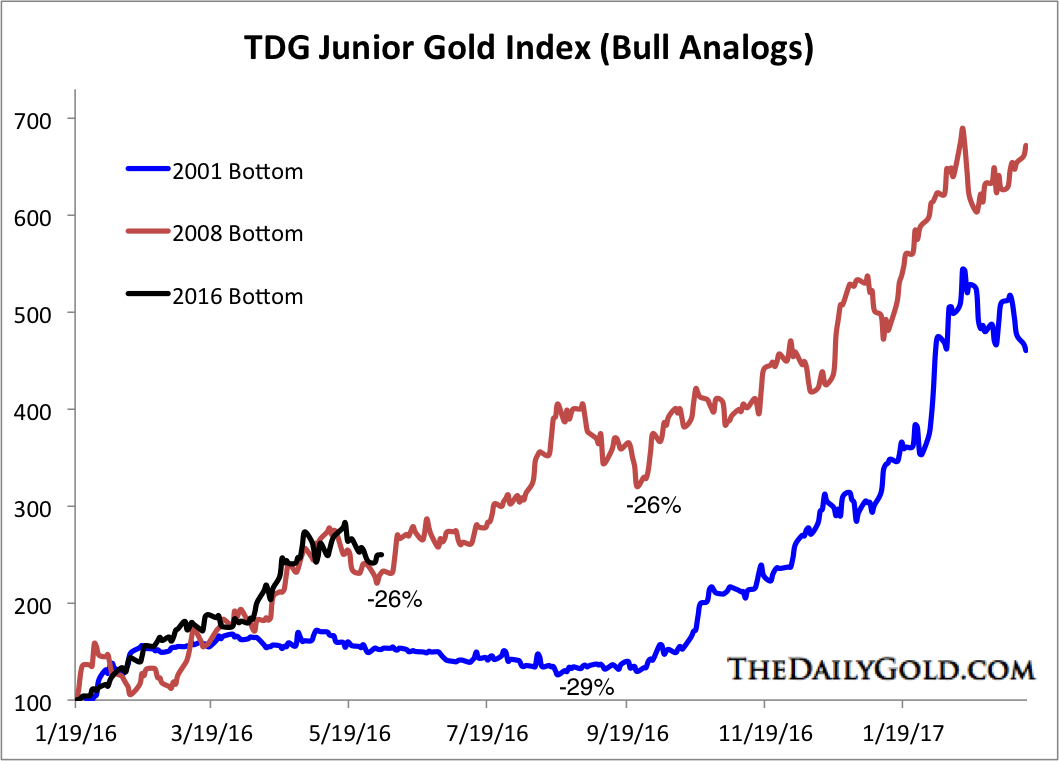
This was an amazing move in the gold stocks that caught many off guard, including me! The data argued and argues for a bigger and longer correction. My junior index corrected only 18% while the corrections in 2001 and 2009 were 29% and 26%. No one can predict if the correction is over or if gold stocks (and juniors especially) will continue to follow their 2008-2009 path. However, we do know a few things. It is a bull market and prices should move higher in the months and quarters ahead. Finally, we know that a bullish consolidation in the weeks ahead followed by a breakout would be inline with recent history (2008-2009). Hold your positions and take advantage of weakness! Consider learning more about our premium service including our favorite junior miners which we expect to outperform in 2016.
Jordan Roy-Byrne, CMT


Comments