After gold’s slide, what happens to miners?

After gold came down hard last week, it might be in a for a short pause and corrective upswing. What will the yellow metal’s next chapter bring for the miners? How high can they go if gold rallies from here?
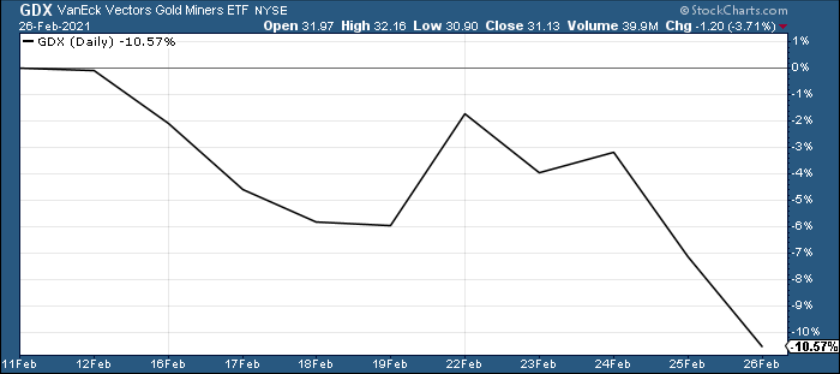
As gold recently moved very close to my approximate target of $1,700, the senior miners (GDX) ended Friday’s (Feb. 26) session $0.13 above my initial downside target of $31 . And while an eventual flush to the $23 to $24 range (or lower) remains on the table, a corrective upswing could be next in line.
To explain, if gold can bounce off of the $1,670 to $1,700 range, the GDX ETF will likely follow suit. Thus, while the miners are likely to move drastically lower over the medium-term, a decline of nearly 11% over the last two weeks has given way to short-term oversold conditions.
Even more precise, if you analyze the chart below, you can see that the GDX ETF has garnered historical support at roughly $29.52. Moreover, the level also coincides with the early-March high, the mid-April low and the 61.8% Fibonacci retracement level. As a result, a corrective upswing to ~$33/$34 could be the miners’ next move.
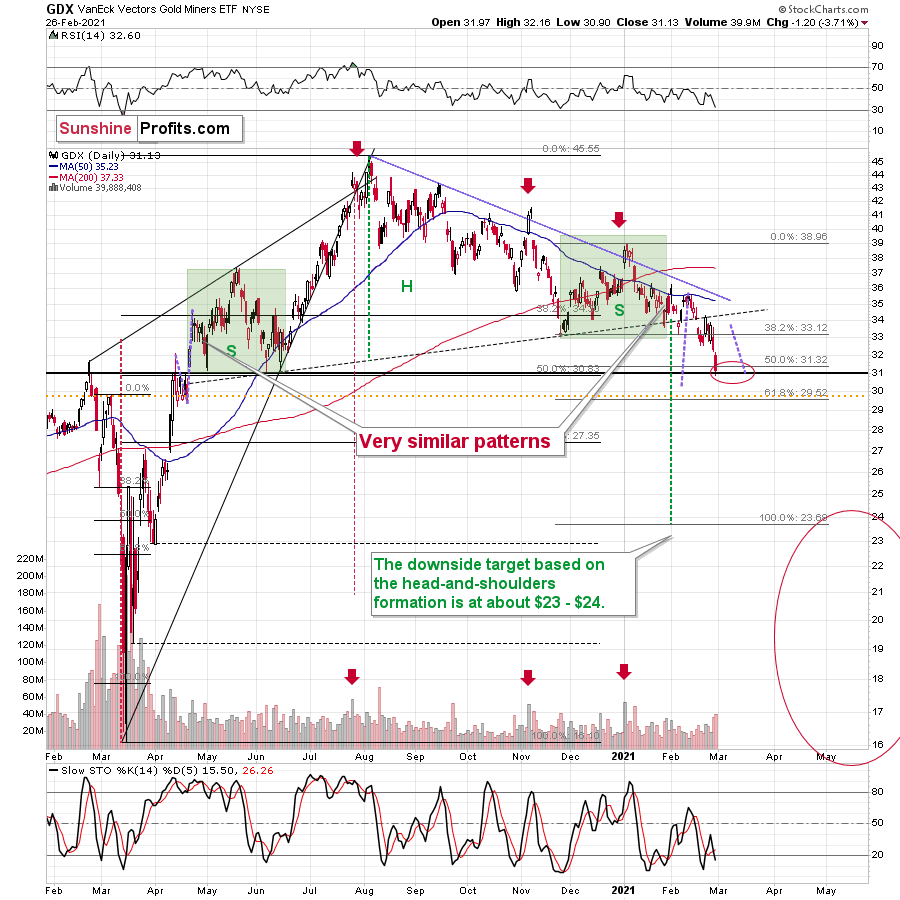
Remember though, if gold does bounce off of the $1,670 to $1,700 range, and the miners are able to ride the momentum higher, ~$33 to ~$34 is where the rally likely ends. From there, the bearish medium-term trend will likely continue, with the miners declining to my secondary target range of $23 to $24.
From a medium-term perspective, the potential head and shoulders pattern – highlighted by the shaded green boxes above – also deserves plenty of attention.
Ever since the mid-September breakdown below the 50-day moving average , the GDX ETF was unable to trigger a substantial and lasting move above this MA. The times when the GDX was able to move above it were also the times when the biggest short-term declines started.
Looking at the chart above, the most recent move higher only made the similarity of this shoulder portion of the bearish head-and-shoulders pattern to the left shoulder ( figure 26 – both marked with green) bigger. This means that when the GDX breaks below the neck level of the pattern in a decisive way, the implications are likely to be extremely bearish for the next several weeks or months.
Due to the uncanny similarity between the two green rectangles, I decided to check what happens if this mirror-similarity continues. I used purple, dashed lines for that. There were two important short-term price swings in April 2020 – one shows the size of the correction and one is a near-vertical move higher.
Copying these price moves (purple lines) to the current situation, we get a scenario in which GDX (mining stocks) moves to about $31 and then comes back up to about $34. This would be in perfect tune with what I wrote previously. After breaking below the head-and-shoulders pattern, gold miners would then be likely to verify this breakdown by moving back up to the neck level of the pattern. Then, we would likely see another powerful slide – perhaps to at least $24.
This is especially the case, since silver and mining stocks tend to decline particularly strongly if the stock market is declining as well. And while the exact timing of the market’s slide is not 100% clear, the day of reckoning for stocks is coming . And it might be very, very close.
As I explained previously, based on the similarities to the 1929 and 2008 declines, it could be the case that the precious metals sector declines for about 3 months after the general stock market tops. And it seems that we won’t have to wait long for the latter. Perhaps the next big move lower in stocks is already underway.
In conclusion, the sun may be about to shine on the precious metals, even if the upcoming rally is not yet destined to last. If the yellow metal can rally off of the $1,670 to $1,700 range, the miners have a pathway to ~$33/$34. Supporting a short-term bounce, abnormally high short interest in U.S. Treasuries could be a contrarian indicator , with a temporary calming of the priors weeks’ yield surge adding fuel to the PMs’ fire. If so, the favorable backdrop could support a temporary bounce before gold and the miners resume their medium-term downtrends.
(By Przemyslaw Radomski)
{{ commodity.name }}
{{ post.title }}
{{ post.date }}


Comments