This is what a mining, metals market meltdown looks like

This is what a mining, metals market meltdown looks like

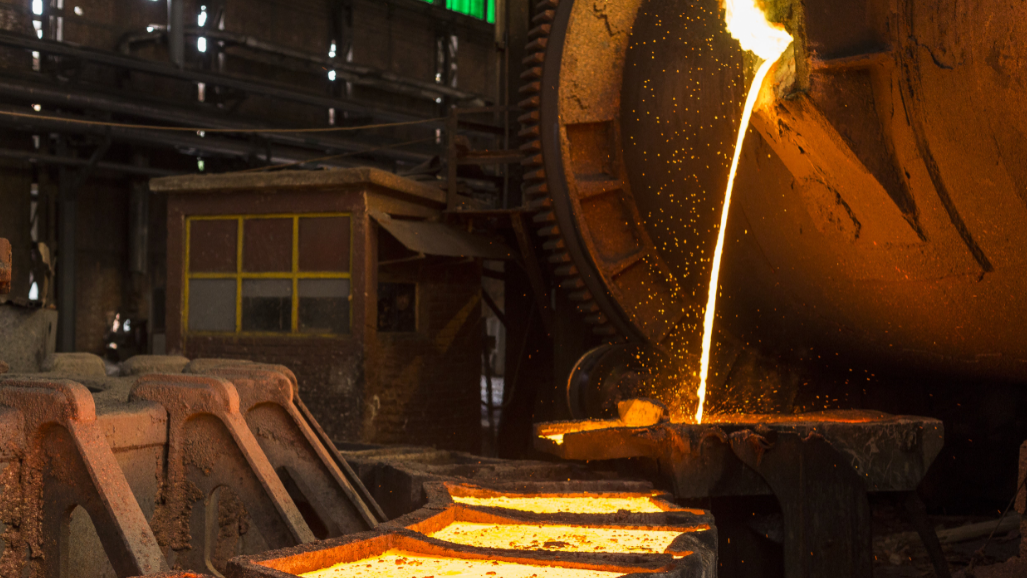
Glencore’s Middelburg South Africa chrome smelter. Image: Glencore

A feeble attempt at a rally yesterday evaporated on Friday with the copper price hitting a fresh six-and-half year low of $1.9365 a pound ($4,270 a tonne) after falling nearly 2% in New York. Following a 26% decline in 2015, copper is already down 9% this year and worth less than half its peak as commodity investors choose to ignore fundamentals pointing to recovery.

Nickel may be the most disappointing performer in a pretty sorry field. The price fell back again today to exchange hands at $8,395 a tonne, with traders using Thursday’s rally to get rid of inventories which have been climbing steadily.

Today’s nickel price is in stark contrast with a 1993 to 2015 average of $13,600 a tonne, so it’s not just the winding down of the supercycle that can be blamed for the metal’s dismal showing. After Indonesia’s ore ban in 2014, the stars seemed to align with the metal hitting $20,000 less than two years ago.

But it appears most miners and analysts misread the market as nickel succumbed to unforeseen forces, not least of which its use in China’s shadow banking system (a factor also blamed for copper’s underperformance). The story is the same across industrial metals with weakness returning to lead, zinc and tin on Friday.

Even zinc, which has had a different trajectory than the rest of the complex due to recent major mine closures has now succumbed to commodity bears. After peaking in November 2006 at  $4,580 per tonne, zinc was still trading at multi-year highs around $2,380 as late as May last year. On Friday the metal dropped to a 2009 low of $1,476.

Australian thermal coal prices hit a high in July 2008 within shouting distance of $200 a tonne but is now averaging in the low $50s (still a price which US domestic producers would kill for) with no hopes of a recovery as Chinese imports fall by more than a third year on year and could cease altogether in the short to medium term.

Coking coal’s fall has been even more spectacular with prices falling to $75 a tonne in November for premium Australian exports, the lowest in at least a decade and worth less than quarter of its peak.

Iron ore’s rise and fall – the commodity most closely associated with the Chinese – actually managed to climb back above $40 a tonne on Friday, but that compares to a peak of $191 a tonne in February 2011 and back to back annual declines of 40% since 2013.

The meltdown in metal prices continue to devastate the stock of mining’s majors on Friday.

World number one BHP Billiton (LON:BHP) had another down day in New York as investors react to the news of a $7.2 billion writedown of its US oil and gas business, the biggest hit the company has take during the resources bust. BHP lost 7% in New York to a fresh 12-year low in anticipation of a dividend cut and a plunge in the price of oil to below $30 a barrel.

Year to date shares in the Anglo-Australian giant is already down 20% for a market capitalization of $54 billion. That compares to $270 billion in 2011 when it briefly became the fifth most valuable publicly traded company in the world, ahead of giants like Chevron and Microsoft.

The world’s second largest miner based on revenue Rio Tinto (NYSE:RIO) gave up 6.3% in New York affording it a market cap of $43 billion. The Melbourne-HQed firm had a better 2015 than its peers thanks to a more manageable debt load and benefitting from the lowest cost base in iron ore, responsible for the vast majority of its earnings, but year-to-date declines have been a steep 19%.

As an indication of just how severe the downturn has been, Rio is the star performer compared to its peers. The stock has (only) declined 71% from its all-time high in 2011.

Vale (VALE:NYQ) came off relatively lightly on Friday with its American Depositary Receipts trading in New York losing 4.2%, but that was enough to reach a new record low. Vale is down 29% in 2016 following a 66% drop last year.  The Rio de Janeiro-based company is the world’s number one producer of iron ore and also holds the top spot for nickel output – both steelmaking raw materials are down more than 80% from their respective peaks. The company’s market value ascended to just shy of $200 billion in January 2011, ahead of its main rival Rio Tinto, but is now worth $12 billion compared.

Reports of an early refinancing of a huge chunk of its debt and reports that it’s close to off-loading a $1 billion Chilean copper mine, did not help Glencore on Friday (LON:GLEN) with the stock giving up 6.5% after an astonishing 108 million shares in the Swiss giant changed hands in London.

The $11 billion company was first floated in May 2011 and two years later the Swiss commodities trader acquired coal giant Xstrata, turning it into the world’s fourth largest miner. Down 19% just this year, Glencore is now worth $24 billion less than before the Xstrata takeover.

Anglo-American (LON:AAL, OTCMKTS:AAUKY), the world’s fifth largest publicly held mining company in terms of output was once again the worst performer plummeting 11.5% as doubts continue to grow over its ability to emerge from under a crippling debt load.

The company with roots in South Africa going back more than a century announced a radical restructuring program in December that would see it cut some 85,000 jobs over the next few years as it reduces the number of mines it operates from 55 to the low 20s.

Despite its exit from gold mining, Anglo is arguably the most diversified of the majors thanks to its exposure to diamonds (accounting for around 25% of its earnings) through De Beers and its holdings in Anglo American Platinum. But that has not shielded the company from the downturn – the stock now trades an astonishing 93% below its 2008 high when it was worth $67 billion.

Freeport-McMoRan (NYSE:FCX), which vies with Chile’s state-owned Codelco as the world’s number one copper producer, was the best performer on the day, adding 3.3%, but that was thanks only to bargain hunters trying to a guess a bottom for the stock which is down 36% since January 4. Volumes were simply massive with more than 73 million shares changing hands, making it the second most actively traded stock on the New York Stock Exchange.

The Phoenix-based company, now worth $5 billion versus more than $5o billion during the boom times. Each $5 fall in  crude prices deducts $170 million from its operating cash flow, while a $0.10 change in the copper price takes out $350 million. In December it emerged that Freeport may put up its oil and gas assets up for auction early next year to refocus  on copper, but no-one expects the company to get anything remotely close to the $20 billion it paid to acquire the US fields just over three years ago.

BHP Market Cap Chart

BHP Market Cap data by YCharts

6 Comments