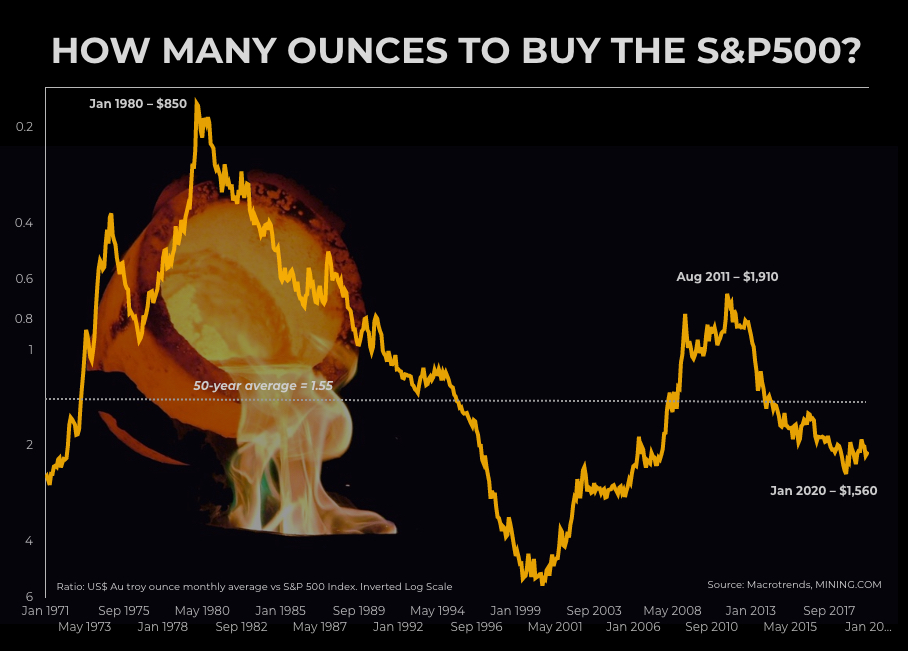
50-year chart shows how cheap gold price still is relative to stocks
The gold price was drifting sideways on Thursday, down some $50 an ounce from a brief (but glorious) near seven-year intraday high above $1,600 an ounce a fortnight ago.
But the metal remains firmly in a bull market with a 20%-plus rise over the past year. Go back 20 years, and the rally is even more spectacular considering at the turn of the century gold was trading for a relative pittance of $270 an ounce.
Is gold overvalued at these levels? Has the rise been too far, too fast? Are gold bugs (once again) guilty of irrational exuberance?
In comparison to stock markets, the answer is a resounding no. The gold price’s underperformance relative to the record–setting S&P 500 Index is stark.
That implies a fair value for gold north of $2,400 which either means gold bugs’ party has only begun or stocks are in for a real beating
Today, you need little over two ounces to buy the market. The ratio was the same in September 2007 when an ounce of gold could be picked up for less than $600.
The average over the long term – and we’re talking 90-years here – is 1.31.
Since the US left the gold standard entirely in August 1971, it’s 1.55. That implies a fair value for gold north of $2,400 an ounce, which either means gold bugs’ party has only begun or stocks are in for a real beating.
You can argue that during gold’s spike in 1980 to $850 an ounce – in inflation-adjusted terms still the all-time high – it lost touch with stock values (and some would say reality) entirely.
But the recent peak – when gold hit a record around $1,900 an ounce in 2011 – did not constitute a wild deviation from the norm, and based on relative value could be in reach once again.

{{ commodity.name }}
{{ post.title }}
{{ post.date }}
2 Comments
poormaninvestor
Because gold was pegged at $35 an ounce for so long we do not have enough data to see any trends. Times have changed ( bad cliche) to where market manipulators and large economic entities (U.S. & China) control the ebb and flow while the corrupt money people have inside info on policy and while they make millions knowing what is going to happen. The only thing they can’t control is the mass of small investors making decisions that effect their own world. Unfortunately today when governments think bigger is better what is going to happen when we get to the point of one big brother. Merry Christmas
quattroluvr
agree with poormaninvestor. There’s way too much gov’t intervention in the history of both gold, and more recently the stock market (QE) to use this ratio average as a useful guide. e.g. Bretton Woods, London Gold Pool, Nixon’s 1971 decision to end gold-$ convertibility, central banks’ gold sales – which have become net buyers more recently especially China. Plus, central banks’ leasing of gold and silver to large bullion banks to manipulate the price of gold. A more useful metric is to look at the physical demand – (way up and headed east into strong Asian hands) versus the extreme and manipulated fractional reserve paper gold market, along with the shrinking of the Comex and LBMA physical inventory that ‘backs’ the fractional paper market. There’s a fair chance that pricing power will shift to Asian exchanges where the cultural DNA and policy favors physical gold. I also forecast that China’s central bank will announce within 1-4 years that they have accumulated bullion gold reserves equal to or exceeding the USA’s nominal Treasury holdings, as part of their recently stated strategic plan to unseat the $USD’s global hegemony. Publicly available data for their non-exported #1 gold mine production (4-500 tons/yr) plus only part of their large gold imports just from Hong Kong’s public stats (ex Shanghai, Beijing bullion imports, ex concentrate/dore imports, etc) put China at around 6000 tons or more already. USA nominally has ~8,000 tons. China stopped reporting their gold reserves in 2009, treating it as a closely guarded state secret. My bet is on China and Russia winning their publicly stated long game of unseating the $USD as the only reserve-currency/petrodollar… unfortunately for USA. The ‘great game’ continues. An ‘interesting time’ for contrarian investors.
http://www.sprott.com/markets-at-a-glance/do-western-central-banks-have-any-gold-left/ is part 1. Also see parts 2 and 3.