The Case for Emerging Markets
One of the best selling points for investing in emerging markets is growth potential, but like any other sector, this growth must come at a reasonable price.
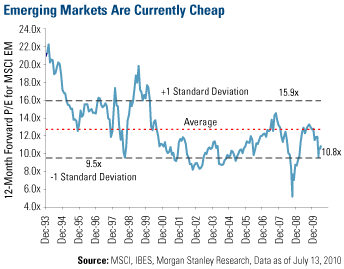
Emerging market stocks are cheap these days. The MSCI Emerging Markets Index has a 12-month forward price-to-earnings ratio of 10.8x, which is 15 percent below the P/E for the MSCI World Index. As you can see on the chart below, this valuation has rarely been more attractive – it is 15 percent below the long-term average.
 On top of that, significant sales growth is expected in global emerging markets – 15 percent and 10 percent, respectively, for 2010 and 2011. The EMEA (Europe, Middle East and Africa) region is expected to lead the way – within EMEA, Turkey is seen as the star with nearly 30 percent sales growth this year and 17 percent in 2011.
Other emerging market standouts in expected sales growth: Taiwan (28 percent), Russia (15.8 percent) and India (15 percent). At 5.5 percent growth, the Philippines is expected to be the laggard.
Sales growth and margin expansion drive earnings growth – UBS predicts a 34 percent jump in earnings for emerging-market equities this year and another 12 percent in 2011.
Emerging market companies also have cleaner balance sheets and lower leverage compared to global peers. Debt-to-equity levels are low and heading lower – UBS sees a drop to 22 percent in 2011 from 28 percent this year. This balance sheet strength gives those companies strategic advantage in raising dividends and targeting their capital expenditure toward areas with the highest potential for return.
| % of 2010 GDP Forecast |
Percentage Point Increase 2007 – 2010 |
||
|---|---|---|---|
| Source: JP Morgan | |||
| Developed | |||
 |
United States | 92.4% | 30.6% |
 |
Japan | 197.2% | 30.1% |
 |
United Kingdom | 83.1% | 36.1% |
 |
Germany | 77.1% | 12.1% |
 |
France | 83.0% | 19.2% |
 |
Italy | 118.4% | 14.9% |
 |
Greece | 133.4% | 37.7% |
| Emerging | |||
 |
Russia | 7.9% | 0.5% |
 |
South Africa | 38.2% | 9.3% |
 |
China | 19.0% | -2.7% |
 |
India | 41.1% | 0.2% |
 |
Brazil | 61.7% | 2.9% |
 |
Turkey | 49.0% | 1.9% |
 |
Indonesia | 32.5% | -3.8% |
The table above from J.P. Morgan shows public-sector debt of selected countries in developed and emerging markets. The contrast is staggering, particularly the rate at which debt is growing in the largest economies – more than 30 percent this year in the U.S., Japan and Britain.
Among emerging markets, only Hungary and the Dominican Republic are expected to see double-digit increases in public-sector debt. China and Indonesia should see a decrease in 2010, while India and Russia are seen as pretty much flat.
This trend represents a major reversal from the past, when investors in developing economies often had to factor in large sovereign debt, high default risk and wildly fluctuating currencies. Government policy changes have contributed greatly to stronger economic fundamentals in many emerging nations, while policy moves by governments have been a source of weakness and uncertainty in the developed world.
Emerging markets have outperformed the world market by 400 basis points since April, when Europe’s sovereign debt crisis accelerated. The key factors discussed above – greater sales growth, cleaner balance sheets and cheaper valuations – make a good case for emerging-market equities to continue this outperformance over the longer term.
John Derrick, director of research, contributed to this article.
Standard deviation is a measure of the dispersion of a set of data from its mean. The more spread apart the data, the higher the deviation. Standard deviation is also known as historical volatility. The MSCI Emerging Markets Index is a free float-adjusted market capitalization index that is designed to measure equity market performance in the global emerging markets. MSCI World Index is a capitalization weighted index that monitors the performance of stocks from around the world.
More News
{{ commodity.name }}
{{ post.title }}
{{ post.date }}


Comments