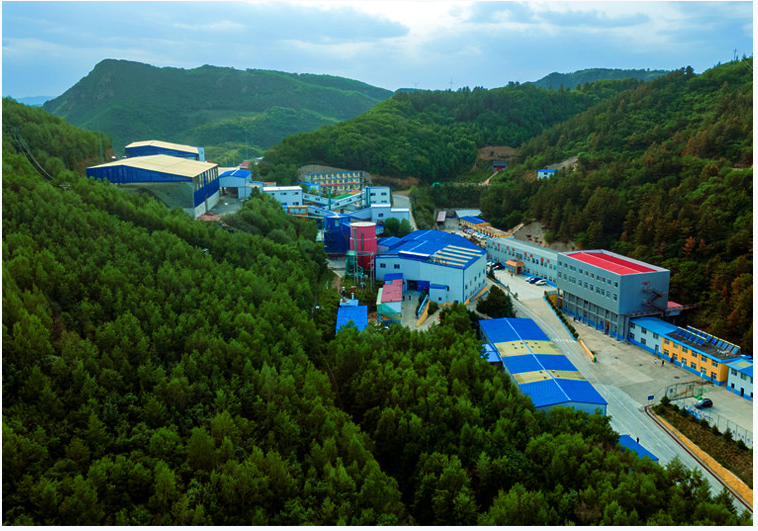
Technical Tips, Volume 1 | Issue 1 – April 19, 2010

The chart of Goldman Sachs closed the week with a key point reversal. (The price bar of the current week made a new price high, but closed below the closing price of the previous week.) This key reversal is a very reliable indicator of a price downturn for Goldman’s shares.

goldman-sachs-gs-ny-weekly-chart3

On Goldman Sachs’ weekly chart, both the MACD and Stochastics have given sell signals and the key point reversal from this week’s high of $186.41 together indicate that a new price bear market has begun. The first price support levels are at $145 and $135. If these levels are broken, further support is at $72 and then the November 2008 low at $47.41 comes under attack. A break of this initial bear market low would likely see GS stock price fall to $35.

The Dow Jones Industrial Average closed the week at 11,018.66 points, which was up on the week by 21.31 points, although Friday was down by 125.91 points.

Among the many newsletters to which we subscribe, there are two Elliott Wave adherents, whose work we greatly admire. These are Robert Prechter and his associates at www.elliottwave.com and Dr. Robert McHugh’s analysis at www.technicalindicatorindex.com. In his latest Elliott Wave Theorist newsletter, Robert Prechter warns of “A Deadly Bearish Big Picture.” He concludes this letter with “Persistent optimism is poison to the market. It’s hard to believe that in just 11 years’ time we will have experienced the three most extreme stock-market tops ever. You can tell your grandkids about it.” Using cycle analogy, Mr. Prechter anticipates that this bear market rally will peak sometime between April 15 and May 7, 2010.

Dr. Robert McHugh makes use of a host of technical indicators to corroborate his Elliott Wave analysis. In this weekend’s report he writes, “The Industrials fell sharply Friday, the worst single day decline since February 4th, 2010. At one point the Industrials were down 170 points (Plunge Protection team in action?), then bounced in a corrective rally, but still closed down 125.91 points at 11,018.66. Stocks fell Friday after reaching upside price targets from several sources, the 60 percent retrace of the decline from October 2007 through March 2006, the 200 week moving average, and the upper boundary of Ascending Expanding Bearish Wedge. We mentioned Thursday that we can also consider the Elliott wave count as finished. Friday’s decline came a few days after we got a sell signal on the VIX. While we did get sell signals Friday on several component indicators, including NDX key trend-finder indicators, the 30 day stochastic indicator for blue chips stock indices remains barely on a buy, which means our Industrial/S&P 500 key trend indicators remain on a sideways signal, not yet on a sell.” Regardless of when the downturn materializes, and we think it is imminent, it will be devastating. Both Robert Prechter and Robert McHugh concur with such a frightening interpretation. So, you should be out of stocks NOW.

dow-jones-industrial-average

The weekly stochastics are rolling over from overbought levels suggesting that a sell signal is imminent. The MACDI is at a lower point than it was when the Dow was 500 points lower than it is now; this is a non-confirmation of the recent upside move, which adds to the conjecture that a top is at hand.

Recently Alan Greenspan was asked what was his greatest fear, he replied “a fall in stock prices.” So you can bet that the ‘Plunge Protec tion Team’ is actively engaged in making sure that stock prices don’t fall. But, they will fall. If they have been artificially supported, the fall will be far worse than it might have been, had nature been allowed to take its course.

The TSE Composite Index fell 106.72 points on the week, closing at 12,100.12. This drop was more attributable to the resource sector stocks than financial stocks, which were basically unmoved by the Goldman Sachs news. Like its UScounterparts, the weekly stochastics on the TSE index are rolling over from an overbought level, which indicates that the index is topping. Price support levels are indicated on the chart.

tse-composite-index

The price of gold bullion closed the week down $29.40 at $1136.90. The gold price made a new high during the week, but closed below the closing price of the previous week, which set up a weekly key point reversal to the downside. The stochastic is rolling over from over bought levels. So we can expect that the gold price will be lower in the coming weeks. The first support level is the middle Bollinger band, which is at $1113.50. A break of this level would suggest a move to the bottom Bollinger band which is at $1065. Further support is at $1044.50. Resistance to a higher gold price is at $1171.

Technical indicators on the daily chart are also giving sell signals, which means, at least in the short term, that the price of gold will favour the downside.

Gold-Weekly chart

Contrary to the bearish indicators manifest on the gold chart, the chart for the HUI, which is called the Gold Bugs Index, because it only includes un-hedged gold companies, favours the bullish or at least a neutral outlook.

hui_gold-bugs-index

The stochastic is still giving a buy signal and the MACDI is close to confirming this. Resistance is initially at $452 and then there is signifi cant resistance around $520, which is a triple top. The price is still above the middle Bollinger band, which is positive. A break below this middle band usually indicates that prices will fall to the bottom band, which is at $380. Further support is at $363.

rfn-ny-weekly-chart

Rydex (RFN) is a double inverse US select sector financial index, which means that its price goes up twice the amount the banking index goes down. When Lehman collapsed in September 2008, its share price had reached $189 and at the March 2009 lows the price was at $90. What makes me salivate are the tightly pinching Bollinger bands over the past five consecutive months. This nearly always means that a big price move is coming to the upside. Personally, I have been buying a goodly amount of RFN waiting for the positive move and I’ve been a little early; but now we have a signal given this week that is a very powerful indicator of a price reversal and in this case a reversal to the upside. Yes, it’s a key point reversal bottom. A week ago (April 9th) RFN made a new low of $4.24 and closed the week at that price; this week (April 16th) RFN made a new all time low at $3.96, but closed at $4.34, which is $0.10 above the close of the previ ous week.

Given Goldman Sachs’ key point reversal top and the Rydex inverse banking index key point reversal bottom, it is highly likely that the stock markets have reached their recovery highs.

Written By: Ian Gordon Ian A. Gordon, The Long Wave Analyst, www.longwavegroup.com Disclaimer : The opinions and conclusions contained in this report are solely those of the author. The information contained in this report is drawn from sources believed to be reliable, but its accuracy and completeness is not guaranteed. It does not provide investment advice, because the author has no knowledge of the specific investment objectives, or the financial circumstances and specific needs of any individual reading this report. The author accepts no responsibility or liability incurred by the reader as a result of any loss incurred in any investment decision by the reader, whether direct or indirect, insofar as the purpose of the article is stimulate thought and enquiry and is opinion and not investment recommendation. All readers must obtain expert investment advice before committing funds.Readers of this