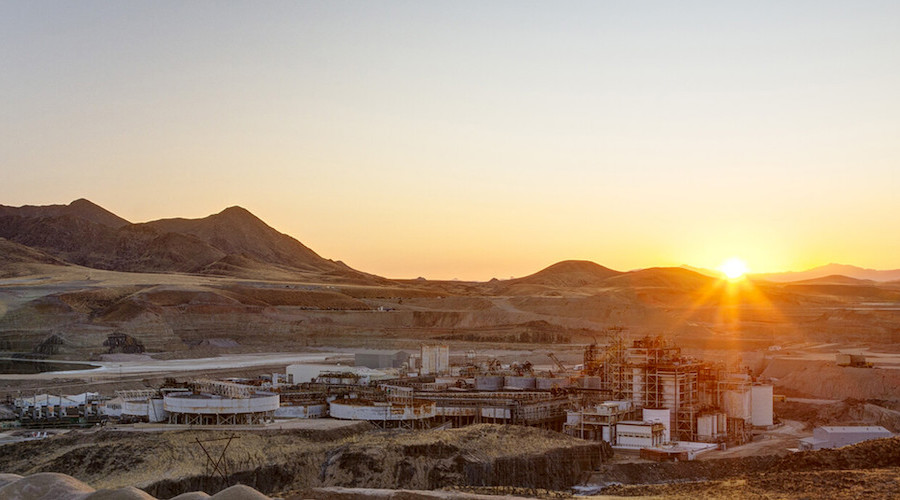
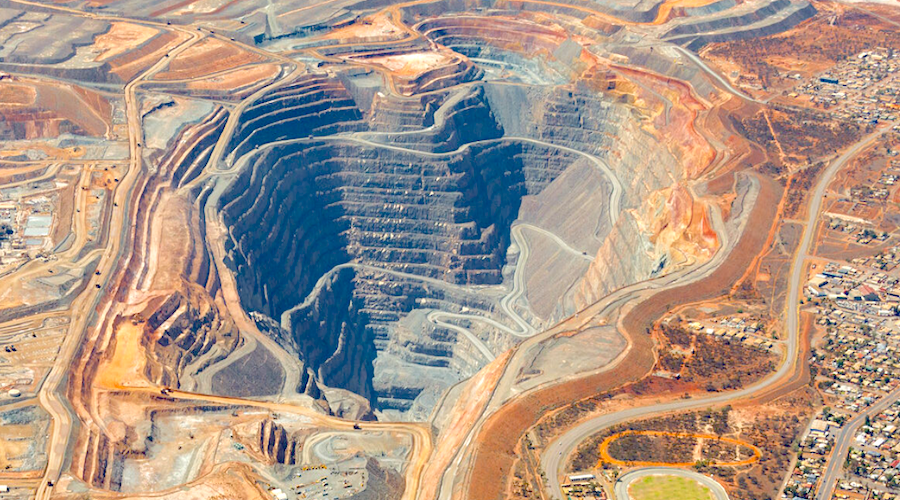
A mineral deposit that matter is a deposit that helps you make money regardless of the economic cycle – has a long life and it has an impact on the global supply.
Forecasts are that supply-demand gaps are going to develop for most of the metals in the next 5-30 years and we need to be smart with our exploration money and spend them only on projects that matter.
<strong>Zinc</strong>: Cam Allen told us that the supply-demand gap (2012 and beyond) should keep the zinc price to $0.65 to $1. In the 2010-2015 interval numerous mines are going to be closed down Skorpion, Lisheen, Brunswick, Broken Hill included. For 2015 the gap is forecasted at 3 Mt.
Focus should be on SEDEX and CRD/skarn deposits as they offer a better chance of success in finding big size deposits. But if you plan in going out for SEDEX then first update your knowledge as nowadays we have a better understanding of where to look for them and of the processes and mechanisms that led to their genesis. The Australians are good at that because they are endowed with many of this type of deposit. Also read GSC (Sullivan, Selwyn Basin), USGS (Red Dog), and AMIRA/CODES.
SEDEX future lies in the Russian Far East (good geology and no exploration); fringes of the Zambian Copper Belt; and, the Chinese Langshan and Qinling (no hole in the last 30 years).
We also had Dave Peck covering <strong>Nickel</strong> – historical perspective, sulphides and non-sulphides (laterites) and metallurgy.
Historical nickel production came from low sovereign risk countries, long life mining operations, there was little speculative investment and prices were linked to the development of the Western World. And there were only a few important producers.
When nickel prices peaked back in 2007 we witnessed an explosion of juniors and investment money flooded the market. Nowadays juniors remain dominant players and they are involved in everything from exploration to mining.
Discovery tools that would help you in finding the next fat one would be gravity gradiometers, heli-borne time domain EM, 3D inversions and multi-element chemical analyses.
No major Ni sulphide discoveries were made but we had many smaller lucky strikes in well known basins/structures.
As for the price of nickel you know that the shiny metal goes where China goes. And the stainless steel demand, of course. And it looks like when LME stockpiles reach four weeks of inventory that’s kind of a tipping point and prices head down a notch.
Recipe for success when exploring for nickel: one would need persistence, low cost drilling and confidence in the geological model. Prospective areas include Brazil and SE Asia. And of course don’t forget that nickel is increasingly sourced from laterites and not sulphides. And laterites are easy to find and explore but they come with some other problems attached – country risk, environmental problems, etc.
Where to put your risk money? On companies exploring known Ni-PGE-Cu sulphide districts. Yeah, you got it right -it’s the PGMs and copper those add value and reduce risk there.
<strong>Uranium</strong> was discussed by Dan Brisbin. Many historical references were made as uranium is a special commodity influenced by politics, military, and civilian uses. Bottom line is that we need it to generate electricity if we want to ride a green wave.
Nowadays the supply/demand gap is filled with secondary U sources that are being drawn down. Peak uranium prices coincided with the largest exploration expenditures that were made in 1978-1979.
Top uranium deposits ranking by size – could be surprising for some people as the first two positions are occupied by huge shale and phosphate deposits while the renowned Olympic Dam makes it only on the third spot.
Unconformity and sandstone hosted uranium deposits provide the bulk of the uranium mined today (close to 50%).
A new development in exploration is that we see uranium veins on faults extending down into the basement below the unconformity. Geophysical imaging of these non-conducting deposit types is something that preoccupies Cameco, the uranium specialist.
The run up in uranium price provided for huge exploration expenditures made by juniors around the world. No new mine opened last year.
In the near future drivers for uranium would include depletion of deposits and stockpiles, new nuclear reactors and undesirability of fossil fuels.
In average electricity demand goes up 2% every year. Estimations are that by 2030 uranium may provide 17% of the world’s power needs.
The <strong>Gold</strong> presentation was delivered by Jay Hodgson – he looked into big gold deposits.
The epithermal, porphyry, greenstone, and epithermal & sedimentary hosted types of deposits represent 38%, 25%, 19% and 17% of gold in >3 Moz deposits population.
Space distribution: Occur in clusters (all scales); in these zones they differ in size and abundance; the largest deposits occur almost entirely in well endowed areas; and, they are accompanied by other types of deposits.
Almost all big deposits (> 20 Moz) occur in high endowment belts, most of them within camp-scale clusters.
Good potential for discovery: SE Asia, Philippines; Nevada (blind, buried, under cover); Abitibi belt; N Quebec and Ontario; the developing gold belt of Mexico; and, Columbia which is starting to open up for business.
A word of advice:
– Don’t chase the ‘large types’ only;
– Do choose the models that are more abundant in the population because there are more of them waiting to be found;
– Corporate constraints on ‘minimum size’ cut down the target population resulting in higher costs per ounce exploration costs.
<strong>Silver</strong> deposits that matter were presented by Bob Quartermain. As usual he delivered a very good presentation of the historical facts, mining, types of deposits, geology and production. A few facts follow.
The high-sulphidation type was predominantly mined for gold. The intermediate type systems are represented by Q-carbonate veins that have significant length (100s to 1000s meters) and display sulphide replacement bodies of mineralization.
A metal zoning is readily apparent in most cases. From bottom to the top that would be: Cu-Zn-Pb (Ag); Ag-Pb-Zn (Au-Cu); and, Ag-Au (Pb, Zn).
Intermediate & low sulphidation epithermal silver deposits are the most productive deposits and represent 60% of all deposits.
The Proterozoic and upper Paleozoic sediment-hosted Cu +Ag deposits produced 9.6 Moz in 2008. Silver is a by-product.
The VMS Base Metals +Ag produced 4.2 Moz in 2008.
The sediment hosted Zn-Pb +Ag (SEDEX, MVT and Broken Hill type) produced 4.2 Moz in 2008.
The porphyry copper + magmatic Ni-Cu-PGM produced another 4.2 Moz in 2008.
Demand: Industrial uses (many new uses) and the advent of the silver ETFs translated in a revival of this precious metal. As a result since 2002 dozens of explorationists were created and new silver mines opened or would open in many parts of the world.
<strong>Copper</strong> and the global copper industry were next and an excellent presentation was delivered by Michael Doggett.
We were quick to learn that sustainability in the global copper industry means one thing: successful exploration.
Over the last 30 years we managed to add 472 Mt of copper and we were efficient because the cost of adding these reserves was low: $0.02 per pound. And in average it takes 21 years from discovery to production.
Copper production almost doubled in the past 30 years (to about 16 Mt). Michael’s calculation indicated that by 2038 we would produce 47 Mt per year.
An important remark: The supply gap is an artificial issue made up by economists; it is not a resource issue.
Over the past 30 years the defining characteristic has become the increase in the scale of the mining operations and the commensurate decrease in unit operating costs and cut-off grades. Thirty years ago the top ten copper mines produced 2.1 Mt now they produce 5.5 Mt.
The ratio reserves/production years average 30 to 33 years of production. In order for us to be able to produce 730 Mt over the next 30 years we need to have 1,035 Mt copper reserves (required to maintain a 30 years reserve base). But in order to find and delineate those reserves we would need to spend at least $59billion over the next 30 years (equivalent to $2 billion per year).
We know that copper price and exploration expenditures levels correlate well. So what copper price do we need to have in place to stimulate us to spend $2 billion per year in exploration? Let’s just say that at $5,000/tonne we only spent 1 billion dollars in exploration.
Long term view: Copper prices need to go up if we want to match our society’s needs.
Mark Selby was the next speaker and he talked about strategic thinking in <strong>global copper </strong>supply and demand.
Main points were that with all the South American development coupled with good copper prices and they were not able to produce more copper. Since mid-1990s copper mine life has fallen by almost 15 years.
The most prospective regions for copper present the highest risk (political, etc) and will require substantial infrastructure investment.
Five major copper projects would be operational this decade but we need five times more copper to be mined if we were to quench the world’s thirst for copper.
Some blame speculators for price fluctuations – not the speaker who believes that they are only making the price to go up faster but they are not the cause of the problem.
In 2005 China consumed an average of 3 kg of copper per capita. Japan, Korea and Taiwan reached the global average of 9+ some 10-13 years after reaching 3 kg per capita. So expect pretty much the same to happen for China – the forecast is that Chinese copper demand would grow at double-digit rates through 2013.
Scrap and destocking kept things in balance. Total copper recovery from scrap is rising sharply (very sensitive to price).
The final note was that copper has the best fundamentals of all base metals.