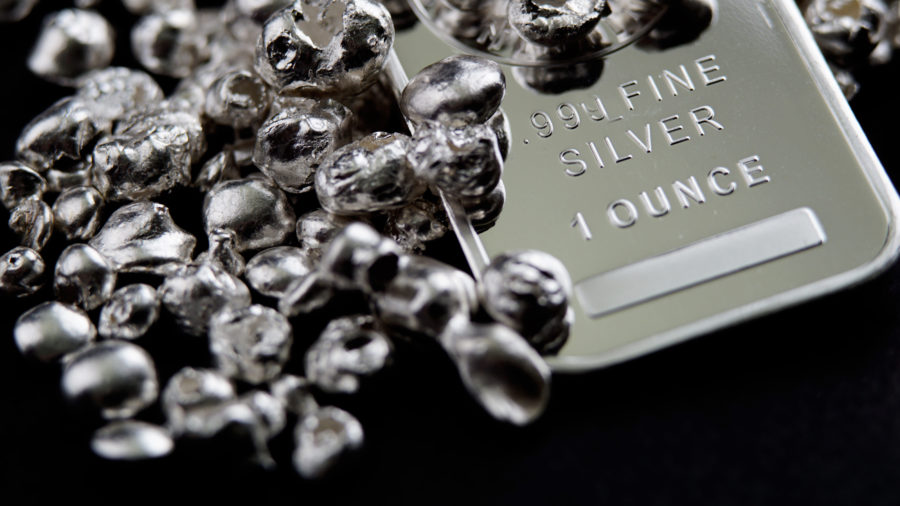
Silver price extends volatile run with surge above $86
Spot prices rose as much as 6.6% to over $86 an ounce, near its highest in a week.

RECORD CONSOLIDATED PRODUCTION AND REVENUES
Toronto, Ontario--(Newsfile Corp. - August 13, 2024) - Andean Precious Metals Corp. (TSXV: APM) (OTCQX: ANPMF) ("Andean" or the "Company") is pleased to report its operating highlights and financial results for the three and six months ended June 30, 2024. All amounts are in United States Dollars unless otherwise stated. This news release should be read together with Andean's management discussion and analysis ("MD&A") and condensed consolidated interim financial statements for the three and six months ended June 30, 2024 (the "Financial Statements") which are available under the Company's profile on SEDAR+ (www.sedarplus.ca).
Second Quarter 2024 Highlights:
Achieved zero lost time injuries and no reportable environmental incidents, demonstrating our commitment to a safe and sustainable operation.
The Company reported a record consolidated production of 29,888 gold equivalent ounces ("AuEq oz"), or its equivalent of 2.5 million silver equivalent ounces ("AgEq oz"), approximately a 40% increase from Q1 20241.
Golden Queen produced 16,986 AuEq oz, a 48% increase compared to Q1 2024, reflecting a strong recovery from the December 2023 fire and improved operations post-acquisition.
San Bartolomé produced 1.1 million AgEq oz, a 30% increase from Q1 2024, driven by a 27% rise in purchased ore.
Subsequent to the end of the quarter, the new Fine Minerals Processing Facility ("FDF") was commissioned on July 23, 2024, now operating at 1,300 tonnes per day with planned ramp up to 1,500 tonnes per day by the end of Q3 2024, enhancing overall performance and sustainability.
The Company recorded consolidated revenue of $69.8 million, with an average realized gold price of $2,305/oz and silver price of $27.81/oz2. This marks a 62% increase, or $26.7 million, compared to Q1 2024, driven by increased production at Golden Queen and San Bartolomé and higher average realized gold and silver prices. Golden Queen's operating cash cost ("OCC") and all-in sustaining cost ("AISC") per ounce of gold sold for the quarter were $1,350 and $1,752, respectively.1
____________________
1. Silver equivalent production and silver equivalent sales include gold production and sales, respectively. Equivalent ounces are calculated using the Company's average realized gold and silver prices during the referenced period. Gold equivalent production and gold equivalent sales include silver production and sales, respectively. Equivalent ounces are calculated using the Company's average realized gold and silver prices during the referenced period. Refer to the "Non-GAAP Financial Measures, Ratios and Supplementary Financial Measures" section below for further detail.2. OCC, AISC and average realized prices are measures of financial performance with no prescribed definition under IFRS and may not be comparable to similar financial measures disclosed by other issuers. Refer to the "Non-GAAP Financial Measures, Ratios and Supplementary Financial Measures" section below for further detail, including a reconciliation of these metrics to the Financial Statements.
San Bartolomé's cash gross operating margin ("CGOM") and Gross Margin Ratio ("GMR") were $5.15 and 24.45% respectively3.
Higher gross profit - Sustainable increased production and higher average realized prices for gold and silver led to a gross profit of $14.5 million, up from $3.2 million in Q1 2024.
Net income (after tax) totaled $9.4 million compared to a net loss of $0.1 million in Q1 2024.
Strong liquid assets maintained to support ongoing strategic growth, totaling $87.0 million as of June 30, 2024.
Share buyback continued. The Company repurchased and cancelled 2,298,000 of its common shares at an average cost of C$0.94 per share for a total cost of $1.6 million (C$2.1 million) through its normal course issuer bid ("NCIB") program.
Strengthened management team with the addition of Sylvain Lessard joining the Company as President and General Manager at Golden Queen Mine.
Alberto Morales, Executive Chairman and CEO, stated, "Our second-quarter results highlight the significant progress and growth following our acquisition of Golden Queen. We have more than doubled our size compared to last year's production and revenue. Compared to Q1 2024, total production increased by approximately 40% to 29,888 gold equivalent ounces, and consolidated revenue rose by 62% to $69.8 million. These achievements underscore our successful integration of Golden Queen and the improved performance at San Bartolomé. Our focus remains on delivering value to our shareholders and pursuing additional growth opportunities as we advance to become a mid-tier producer.
During the quarter, we also advanced our FDF project, completing all concrete, structural steel, and mechanical work, while effectively managing costs, $5.5 million incurred against a $6.7 million budget. The commissioning of our Fine Minerals Processing Plant on July 23, 2024, was a key milestone, now operating at 1,300 tonnes per day with plans to reach 1,500 tonnes by the end of Q3.
Golden Queen's 48% production increase and San Bartolomé's 30% rise in silver equivalent ounces highlight the success of our strategic initiatives. These advances boosted our gross profit to $14.5 million and net income to $9.4 million, marking a strong turnaround."
Mr. Morales continued, "Looking ahead, our strong financial position and operating milestones reaffirms our overall consolidated guidance for 2024. The FDF deposit, with its substantial resource base, aligns with our sustainability goals, contributing to improved silver recovery and reduced environmental impact. Our commitment to safety and environmental stewardship remains strong, evidenced by zero lost time injuries and no reportable environmental incidents this quarter."
_______________________
3. Cash gross operating margin ("CGOM") per equivalent ounce sold is calculated by subtracting the average cash cost of sale (Costs of sales, excluding depreciation depletion and amortization), allocated corporate administration costs and business unit general and administration cost per equivalent ounces sold from the average selling price per equivalent ounces. It is a measure of financial performance with no prescribed definition under IFRS. Refer to "Non-GAAP Financial Measures, Ratios and Supplementary Financial Measures" section below for further detail, including a reconciliation of these metrics to the Financial Statements. Gross margin ratio ("GMR") is calculated by subtracting the cost of sale, excluding depreciation depletion and amortization, as reported in the income statements from the revenue from sales of equivalent ounces divided by revenue from sales of equivalent ounces. It is a measure of financial performance with no prescribed definition under IFRS. Refer to the "Non-GAAP Financial Measures, Ratios and Supplementary Financial Measures" section below for further detail, including a reconciliation of these metrics to the Financial Statements.
Summary of Financial and Operating Results
| (In thousands except for net income per share and oz) | Q2 2024 | Q2 2023 | Change | YTD 2024 | YTD 2023 | Change | |||||||||||
| Financial Performance | |||||||||||||||||
| Revenue | $ | 69,779 | $ | 15,284 | $ | 357% | 112,849 | $ | 38,329 | 194% | |||||||
| Cost of sales | 47,847 | 11,771 | 306% | 85,126 | 32,988 | 158% | |||||||||||
| Depreciation and depletion | 7,399 | 1,065 | 595% | 10,029 | 2,519 | 298% | |||||||||||
| Gross profit | 14,533 | 2,488 | 494% | 17,694 | 2,822 | 527% | |||||||||||
| Net income (after tax) | 9,385 | 169 | 5,453% | 9,309 | 388 | 2,299% | |||||||||||
| Net income per share | |||||||||||||||||
| -Basic | 0.06 | 0.00 | - | 0.06 | 0.00 | - | |||||||||||
| -Diluted | 0.06 | 0.00 | - | 0.06 | 0.00 | - | |||||||||||
| Net cash provided from (used in) operating activities | 13,006 | (5,293) | - | 8,307 | (9,616) | - | |||||||||||
| Free cash flow4 | 7,788 | (5,588) | - | (303) | (10,474) | - | |||||||||||
| EBITDA4 | 24,498 | 3,657 | 570% | 28,099 | 5,173 | 443% | |||||||||||
| Adjusted EBITDA4 | 21,732 | 4,928 | 341% | 24,671 | 5,401 | 357% | |||||||||||
| Capital expenditures | (5,218) | (295) | (1,669%) | (8,610) | (858) | (903%) | |||||||||||
| Ending cash and cash equivalents | 47,049 | 70,427 | (33%) | 47,049 | 70,427 | (33%) | |||||||||||
| Marketable securities and investments | 39,911 | 4,687 | 752% | 39,911 | 4,687 | 752% | |||||||||||
| Total cash and short-term investments | 86,960 | 75,114 | 16% | 86,960 | 75,114 | 16% | |||||||||||
| (In thousands except for metal price per oz) | Q2 2024 | Q2 2023 | Change | YTD 2024 | YTD 2023(g) | Change | |||||||||||
| Operating highlights | |||||||||||||||||
| Production | |||||||||||||||||
| Golden Queen | |||||||||||||||||
| Silver (koz) | 157 | - | - | 265 | - | - | |||||||||||
| Gold (oz) | 15,035 | - | - | 25,294 | - | - | |||||||||||
| Total AuEq ounces produced (oz) | 16,986 | - | - | 28,476 | - | - | |||||||||||
| San Bartolomé | |||||||||||||||||
| Silver (koz) | 1,051 | 1,189 | (12%) | 1,863 | 2,167 | (14%) | |||||||||||
| Gold (oz) | 274 | 396 | (31%) | 448 | 630 | (29%) | |||||||||||
| Total AgEq ounces produced (koz) | 1,074 | 1,221 | (12%) | 1,901 | 2,218 | (14%) | |||||||||||
| Consolidated | |||||||||||||||||
| Golden Queen AgEq oz (koz) | 1,403 | - | 2,417 | - | |||||||||||||
| San Bartolomé AgEq oz (koz) | 1,074 | 1,221 | (12%) | 1,901 | 2,218 | (14%) | |||||||||||
| Total Consolidated AgEq ounces produced (koz) | 2,477 | 1,221 | 103% | 4,319 | 2,218 | 95% | |||||||||||
| Sales | |||||||||||||||||
| Golden Queen | |||||||||||||||||
| Silver (koz) | 153 | - | - | 261 | - | - | |||||||||||
| Gold (oz) | 15,441 | - | - | 25,563 | - | - | |||||||||||
| Total AuEq oz sold (oz) | 17,348 | - | - | 28,691 | - | - | |||||||||||
| San Bartolomé | |||||||||||||||||
| Silver (koz) | 1,057 | 620 | 71% | 1,868 | 1,602 | 17% | |||||||||||
| Gold (oz) | 238 | - | 100% | 408 | 215 | 90% | |||||||||||
| Total AgEq oz sold (koz) | 1,076 | 620 | 74% | 1,902 | 1,620 | 17% | |||||||||||
| Consolidated ounces sold | |||||||||||||||||
| Golden Queen AgEq oz (koz) | 1,433 | - | 2,436 | - | |||||||||||||
| San Bartolomé AgEq oz (koz) | 1,076 | 620 | 74% | 1,902 | 1,620 | 17% | |||||||||||
| Total Consolidated AgEq oz sold (koz) | 2,509 | 620 | 305% | 4,339 | 1,620 | 168% | |||||||||||
| Average realized silver price ($/oz) | $ | 27.81 | $ | 24.65 | 13% | 26.01 | $ | 23.67 | 10% | ||||||||
| Average market silver price ($/oz) | $ | 28.79 | $ | 24.15 | 19% | 26.08 | $ | 23.33 | 12% | ||||||||
| Average realized gold price ($/oz) | $ | 2,305 | $ | - | $ | 100% | 2,213 | $ | 1,930 | 15% | |||||||
| Average market gold price ($/oz) | $ | 2,337 | $ | 1,977 | $ | 18% | 2,203 | $ | 1,932 | 14% | |||||||
4. Free cash flow, EBITDA and Adjusted EBITDA are measures of financial performance with no prescribed definition under IFRS. Refer to the "Non-GAAP Financial Measures, Ratios and Supplementary Financial Measures" section below for further detail, including a reconciliation of these metrics to the Financial Statements.
2024 Outlook and Guidance
Production guidance
The Company is maintaining the 2024 annual gold and silver equivalent production guidance for Golden Queen and San Bartolomé.
| 2024 AuEq oz Guidance5 +/- 5% | 2024 AgEq oz Guidance5 +/- 5% | ||
| Golden Queen (koz) | 60 | 5,429 | |
| San Bartolomé (koz) | 55 | 5,000 | |
| Consolidated (koz) | 115 | 10,429 | |
Quarter-to-quarter gold production in 2024 is expected to fluctuate during the year, with production continuing to be weighted towards the second half of the year.
Cost guidance
The Company is maintaining the 2024 cost guidance for Golden Queen and San Bartolomé as shown below:
| 2024 Guidance +/- 5% | ||||
| Golden Queen | ||||
| OCC per gold ounce sold, on a by-product credit basis[2] | $ 1,500 | |||
| AISC per gold ounce sold, on a by-product credit basis | $ 1,750 | |||
| San Bartolomé | ||||
| CGOM | $ 3.88 | |||
| GMR | 19.5% | |||
In line with 2024 guidance, capital investment is expected to total $24.0 million (+/-5%), largely due to the $9.5 million included in the growth capital for the procurement of six new 785-8 haul trucks, as part of the Company's strategic mobile fleet replacement and mine optimization. These trucks will be financed through an equipment finance 5-year facility. Included in the sustaining capital at Golden Queen is the capitalization of the major overhaul maintenance/rebuild of equipment costs of $8.3 million. As of June 30, 2024, two new trucks out of the planned additional six have been commissioned.
Capital expenditures guidance
| In $'000 | 2024 Guidance +/- 5% | ||
| Sustaining capital | |||
| Golden Queen | $ | 10,300 | |
| San Bartolomé | 3,400 | ||
| Total sustaining capital | $ | 13,700 | |
| Growth capital | |||
| Golden Queen | $ | 9,500 | |
| San Bartolomé | 840 | ||
| Total growth capital | $ | 10,340 | |
| Total capital | |||
| Golden Queen | $ | 19,800 | |
| San Bartolomé | 4,240 | ||
| Total capital expenditures | $ | 24,040 |
5. Assuming gold equivalent ounces were calculated on a consolidated basis for the Company, the expected guidance of 10.4 million silver equivalent ounces would equate to approximately 115,000 gold AuEq ounces. AuEq production and AuEq sales both include silver production and sales. Equivalent ounces are calculated using the Company's average realized gold and silver prices during the referenced period. For 2024 guidance commodity price assumptions supporting this estimate are $21 per ounce of silver and $1,900 per ounce of gold.
Q2 2024 Conference Call and Webcast
Wednesday, August 14, at 9:00 AM ET
Participants may listen to the webcast by registering on our website at www.andeanpm.com or via the following link https://www.gowebcasting.com/13407
Participants may also listen to the conference call by calling North American toll free 1-844-763-8274, or 1-647-484-8814 outside the U.S. or Canada
An archived reply of the webcast will be available for 90 days at: https://www.gowebcasting.com/13407 or the Company website at www.andeanpm.com.
About Andean Precious Metals
Andean is a growth-focused precious metals producer that owns and operates the San Bartolomé project located in the department of Potosí, Bolivia. San Bartolomé has been operating continuously since 2008, producing an average of 5 million oz of silver equivalent per year. The Company is seeking accretive growth opportunities in Bolivia and the wider Americas. Andean is committed to fostering safe, sustainable, and responsible operations.
Qualified Person Statement
The scientific and technical content disclosed in this news release was reviewed and approved 8 by Donald J. Birak, Independent Consulting Geologist to the Company, a Qualified Person as defined by National Instrument 43-101 - Standards for Disclosure for Mineral Projects, Registered Member, Society for Mining, Metallurgy and Exploration (SME), Fellow, Australasian Institute of Mining and Metallurgy (AusIMM). Mr. Birak has visited Manquiri's various sites frequently, most recently in January 2024.
For more information, please contact:
Amanda Mallough Director, Investor Relations [email protected] T: +1 647 463 7808
Neither the TSX Venture Exchange, Inc. nor its Regulation Services Provider (as that term is defined in policies of the TSX Venture Exchange) accepts responsibility for the adequacy or accuracy of this release.
Caution Regarding Forward-Looking Statements
Certain statements and information in this release constitute "forward-looking statements" within the meaning of applicable U.S. securities laws and "forward-looking information" within the meaning of applicable Canadian securities laws, which we refer to collectively as "forward-looking statements". Forward-looking statements are statements and information regarding possible events, conditions or results of operations that are based upon assumptions about future economic conditions and courses of action. All statements and information other than statements of historical fact may be forward-looking statements. In some cases, forward-looking statements can be identified by the use of words such as "seek", "expect", "anticipate", "budget", "plan", "estimate", "continue", "forecast", "intend", "believe", "predict", "potential", "target", "may", "could", "would", "might", "will" and similar words or phrases (including negative variations) suggesting future outcomes or statements regarding an outlook.
Forward-looking statements in this release include, but are not limited to, statements and information regarding the Company's production,cost outlook and capital expenditure expectations for 2024. Such forward-looking statements are based on a number of material factors and assumptions, including, but not limited to: the Company's ability to carry on exploration and development activities; the Company's ability to secure and to meet obligations under property and option agreements and other material agreements; the timely receipt of required approvals and permits; that there is no material adverse change affecting the Company or its properties; that contracted parties provide goods or services in a timely manner; that no unusual geological or technical problems occur; that plant and equipment function as anticipated and that there is no material adverse change in the price of silver, costs associated with production or recovery. Forward-looking statements involve known and unknown risks, uncertainties and other factors which may cause actual results, performance or achievements, or industry results, to differ materially from those anticipated in such forward-looking statements. The Company believes the expectations reflected in such forward-looking statements are reasonable, but no assurance can be given that these expectations will prove to be correct, and you are cautioned not to place undue reliance on forward-looking statements contained herein.
Some of the risks and other factors which could cause actual results to differ materially from those expressed in the forward-looking statements contained in this release include, but are not limited to: risks and uncertainties relating to the interpretation of drill results, the geology, grade and continuity of mineral deposits and conclusions of economic evaluations; results of initial feasibility, pre-feasibility and feasibility studies, and the possibility that future exploration, development or mining results will not be consistent with the Company's expectations; risks relating to possible variations in reserves, resources, grade, planned mining dilution and ore loss, or recovery rates and changes in project parameters as plans continue to be refined; mining and development risks, including risks related to accidents, equipment breakdowns, labour disputes (including work stoppages and strikes) or other unanticipated difficulties with or interruptions in exploration and development; the potential for delays in exploration or development activities or the completion of feasibility studies; risks related to the inherent uncertainty of production and cost estimates and the potential for unexpected costs and expenses; risks related to commodity price and foreign exchange rate fluctuations; the uncertainty of profitability based upon the cyclical nature of the industry in which the Company operates; risks related to failure to obtain adequate financing on a timely basis and on acceptable terms or delays in obtaining governmental or local community approvals or in the completion of development or construction activities; risks related to environmental regulation and liability; political and regulatory risks associated with mining and exploration; risks related to the uncertain global economic environment; and other factors contained in the section entitled "Risk Factors" in the Company's MD&A dated June 30, 2024.
Although the Company has attempted to identify important factors that could cause actual results or events to differ materially from those described in the forward-looking statements, you are cautioned that this list is not exhaustive and there may be other factors that the Company has not identified. Furthermore, the Company undertakes no obligation to update or revise any forward-looking statements included in this release if these beliefs, estimates and opinions or other circumstances should change, except as otherwise required by applicable law.
Non-GAAP Financial Measures, Ratios and Supplementary Financial Measures
This news release "specified financial measures" within the meaning of National Instrument 52-112 - Non-GAAP and Other Financial Measures Disclosure, specifically the non-GAAP financial measures, non-GAAP ratios and supplementary financial measures described below. Management believes that the use of these measures assists analysts, investors and other stakeholders of the Company in understanding the costs associated with producing silver and gold, understanding the economics of silver and gold mining, assessing operating performance, the Company's ability to generate free cash flow from current operations and on an overall Company basis, and for planning and forecasting of future periods.
The specified financial measures used in this news release do not have any standardized meaning prescribed by IFRS and may not be comparable to similar measures presented by other issuers, even as compared to other issuers who may be applying the World Gold Council guidelines. Accordingly, these measures are intended to provide additional information and should not be considered in isolation or as a substitute for measures of performance prepared in accordance with IFRS.
The following is a description of the non-GAAP financial measures, non-GAAP ratios and supplementary financial measures used in this news release:
(i) OCC includes total production cash costs incurred at the Company's mining operations, which form the basis of the Company's cash costs, less by-product revenue.
(ii) AISC on a by-product basis per ounce is a non-GAAP ratio calculated as AISC on a by-product basis divided by ounces of gold sold. AISC on a by-product basis is a non-GAAP financial measure calculated as the aggregate of production costs as recorded in the consolidated statements of income (loss), refining and transport costs, cash component of sustaining capital expenditures, lease payments related to sustaining assets, corporate general and administrative expenses and accretion expenses. When calculating AISC on a by-product basis, all revenue received from the sale silver at Golden Queen are treated as a reduction of costs incurred. The Company believes that AISC represents the total costs of producing gold from current operations and provides the Company and other stakeholders of the Company with additional information relating to the Company's operational performance and ability to generate cash flow.
(iii) AIC represents AISC plus growth capital and non-sustaining exploration and evaluation costs. Non-sustaining exploration and evaluation costs represent costs associated with the Company's exploration portfolio. Certain other cash expenditures including tax payments, debt payments, dividends and financing costs are also not included in the calculation of AIC. The Company reports these measures on a per gold ounce sold basis.
(iv) CGOM per equivalent ounce sold is calculated by subtracting the average cash cost of sale (cost of sales, allocated corporate administrative costs and business unit general and administration cost) per equivalent ounce sold from the average selling price per equivalent ounce. It is a measure of financial performance with no prescribed definition under IFRS and may not be comparable to similar financial measures disclosed by other issuers.
(v) GMR is calculated by subtracting the cost of sale as reported in the income statement from the revenue of equivalent ounces divided by revenue from sales of equivalent ounces. GMR is a measure of financial performance with no prescribed definition under IFRS and may not be comparable to similar financial measures disclosed by other issuers.
(vi) EBITDA is defined as earnings before interest, tax, depreciation and amortization. Adjusted EBITDA is a non-GAAP financial measure calculated by adjusting net income (loss) as recorded in the condensed interim consolidated statements of income (loss) for items not associated with ongoing operations. The Company believes that this generally accepted industry measure allows the evaluation of the results of income-generating capabilities and is useful in making comparisons between periods. This measure adjusts for the impact of items not associated with ongoing operations. A reconciliation of adjusted net income (loss) to the nearest IFRS measures is set out below. Management uses this measure to monitor and plan for the operating performance of the Company in conjunction with other data prepared in accordance with IFRS.
(vii) Free cash flow is a non-GAAP financial measure calculated as cash provided by operating activities from continuing operations less property, plant and equipment additions. A reconciliation of free cash flow to the nearest IFRS measures is set out below. Management uses this measure to monitor the amount of cash available to reinvest in the Company and allocate for shareholder returns.
(viii) Average realized price is a supplementary financial measure calculated by dividing the different components of precious metal sales by the number of ounces sold. Management uses this measure to monitor its sales of precious metal ounces against the average market gold price.
OCC
The following table provides a reconciliation of the OCC per ounce sold on a by-product basis to the Financial Statements:
| Golden Queen | Three months ended June 30, | Six months ended June 30, | ||||||||||||
| (In thousands except for ounces and per ounce measures) | 2024 | 2023 | 2024 | 2023 | ||||||||||
| Costs of sales, as reported | $ | 25,239 | $ | - | $ | 44,236 | $ | - | ||||||
| Total OCC before by-product credits | 25,239 | - | 44,236 | - | ||||||||||
| Less: by-product silver credits | (4,390) | - | (6,924) | - | ||||||||||
| Total OCC | 20,849 | $ | - | $ | 37,312 | $ | - | |||||||
| Divided by Au ounces sold | 15,441 | - | 25,563 | - | ||||||||||
| OCC per Au ounce sold, on a by-product basis | 1,350 | $ | - | $ | 1,460 | $ | - | |||||||
AISC
The following table provides a reconciliation of the AISC per ounce on a by-product basis to the Financial Statements:
| Golden Queen | Three months ended June 30, | Six months ended June 30, | ||||||||
| (In thousands except for ounces and per ounce measures) | 2024 | 2023 | 2024 | 2023 | ||||||
| OCC, net of by-product credits | $ | 20,849 | $ | - | $ | 37,312 | $ | - | ||
| General and administrative expenses [3] | 1,860 | - | 3,229 | - | ||||||
| Allocated corporate general and administrative expenses | 1,036 | - | 1,575 | |||||||
| Sustaining capital expenditures | 3,224 | $ | - | 4,333 | - | |||||
| Accretion for decommissioning liability | 84 | - | 195 | - | ||||||
| AISC | 27,053 | $ | - | $ | 46,648 | $ | - | |||
| Divided by Au ounces sold | 15,441 | 25,563 | - | |||||||
| AISC per Au ounce sold, on a by-product basis | $ | 1,752 | $ | - | $ | 1,825 | $ | - | ||
AIC
The following table provides a reconciliation of the AIC per ounce on a by-product basis to the Financial Statements:
| Golden Queen | Three months ended June 30, | Six months ended June 30, | ||||||||
| (In thousands except for ounces and per ounce measures) | 2024 | 2023 | 2024 | 2023 | ||||||
| AISC | $ | 27,053 | $ | - | $ | 46,648 | $ | - | ||
| Non-sustaining capital | 457 | - | 866 | - | ||||||
| AIC | $ | 27,510 | - | $ | 47,514 | $ | - | |||
| Divided by Au ounces sold | 15,441 | $ | - | 25,563 | - | |||||
| AIC per Au ounce sold, on a by-product basis | $ | 1,782 | - | $ | 1,859 | $ | - | |||
CGOM
The following table provides a reconciliation of the CGOM per ounce to the Financial Statements and the most directly comparable IFRS measure:
| San Bartolomé | Three months ended June 30, | Six months ended June 30, | |||||||||||
| (In thousands except for ounces and per ounce measures) | 2024 | 2023 | 2024 | 2023 | |||||||||
| Costs of sales, as reported | $ | 22,607 | $ | 11,769 | $ | 40,890 | $ | 32,988 | |||||
| Total cost of sales before by-product credits | 22,607 | 11,769 | 40,890 | 32,988 | |||||||||
| General and administration-site | 1,000 | 1,571 | 2,476 | 2,926 | |||||||||
| Allocated corporate general and administrative expenses | 776 | 1,000 | 1,223 | 2,000 | |||||||||
| Total gross operating costs | $ | 24,383 | $ | 14,340 | $ | 44,589 | $ | 37,914 | |||||
| Divided by AgEq oz sold (koz) | 1,076 | 620 | 1,902 | 1,620 | |||||||||
| Gross operating cost per AgEq oz sold | $ | 22.66 | $ | 23.14 | $ | 23.44 | $ | 23.41 | |||||
| Average realized silver price per oz | $ | 27.81 | $ | 24.66 | $ | 26.01 | $ | 23.67 | |||||
| CGOM per AgEq oz | $ | 5.15 | $ | 1.52 | $ | 2.57 | $ | 0.26 | |||||
3 For Q 1 2024 general and administrative expenses reflect the operating segment information only.
GMR
The following table provides a reconciliation of the GMR per ounce to the most directly comparable IFRS measure:
| San Bartolomé | Three months ended June 30, | Six months ended June 30, | ||||||||||
| (In thousands except for ounces and per ounce measures) | 2024 | 2023 | 2024 | 2023 | ||||||||
| Costs of sales, as reported | $ | 22,607 | $ | 11,769 | $ | 40,890 | $ | 32,988 | ||||
| Divided by AgEq oz sold (koz) | $ | 1,076 | 620 | 1,902 | 1,620 | |||||||
| Costs of sales per AgEq oz sold | $ | 21.01 | $ | 19.00 | $ | 21.50 | $ | 20.37 | ||||
| Average realized silver price per oz | $ | 27.81 | $ | 24.66 | $ | 26.01 | $ | 23.67 | ||||
| GM per AgEq oz sold | $ | 6.80 | $ | 5.66 | $ | 4.51 | $ | 3.30 | ||||
| GMR per AgEq oz sold | 24.45% | 22.95% | 17.34% | 13.94% | ||||||||
Free Cash Flow
The Company has included free cash flow as a non-GAAP financial measure in this news release. The Company considers net cash provided from (used in) operating cash flow less capital expenditures to be a measure that allows the Company and investors to evaluate the ability of the Company to generate cash flow. Accordingly, free cash flow is intended to provide additional information and should not be considered in isolation or as a substitute for measures of performance prepared in accordance with IFRS.
The following table provides a reconciliation of free cash flow to the Financial Statements:
| Three months ended June 30, | Six months ended June 30, | |||||||||||
| (In thousands) | 2024 | 2023 | 2024 | 2023 | ||||||||
| Net cash flow from operating activities | $ | 13,006 | $ | (5,293 | ) | $ | 8,307 | $ | (9,616 | ) | ||
| Less: | ||||||||||||
| Expenditures on property, plant and equipment | (5,218 | ) | (295 | ) | (8,610 | ) | (858 | ) | ||||
| Free cash flow | $ | 7,788 | $ | (5,588 | ) | $ | (303 | ) | $ | (10,474 | ) | |
EBITDA and Adjusted EBITDA
The Company has included EBITDA and Adjusted EBITDA as a non-GAAP financial measure in this news release. The Company excludes certain items from net income (loss)to provide a measure which allows the Company and investors to evaluate the results of the underlying core operations of the Company and its ability to generate cash flow. Accordingly, it is intended to provide additional information and should not be considered in isolation or as a substitute for measures of performance prepared in accordance with IFRS.
The following table provides a reconciliation of Adjusted EBITDA to the Financial Statements:
| Three months ended June 30, | Six months ended June 30, | |||||||||||||||
| (In thousands) | Q2 2024 | Q2 2023 | Q2 2024 | Q2 2023 | ||||||||||||
| Net (loss) income | $ | 9,385 | $ | 169 | $ | 9,309 | $ | 388 | ||||||||
| Add: | ||||||||||||||||
| Income taxes | 6,090 | 2,016 | 5,487 | 1,459 | ||||||||||||
| Finance costs | 1,624 | 407 | 3,274 | 807 | ||||||||||||
| Depreciation and depletion | 7,399 | 1,065 | 10,029 | 2,519 | ||||||||||||
| EBITDA | $ | 24,498 | $ | 3,657 | $ | 28,099 | $ | 5,173 | ||||||||
| Add: Non-sustaining exploration and evaluation costs | 417 | 389 | 649 | (63 | ) | |||||||||||
| Add: Corporate development costs | 200 | 403 | 379 | 576 | ||||||||||||
| Add: Change in fair value of derivative contracts | (1,980 | ) | (972 | ) | (2,832 | ) | (972 | ) | ||||||||
| Add: Change in fair value of marketable securities | (1,403 | ) | 1,451 | (1,624 | ) | 687 | ||||||||||
| Adjusted EBITDA | $ | 21,732 | $ | 4,928 | $ | 24,671 | $ | 5,401 | ||||||||
Average Realized Gold and Silver Prices Per Ounce
The Company has included average realized prices as a supplementary non-GAAP financial measure in this news release. The Company quantifies average realized price per ounce as revenue per the Statement of Income (loss) divided by ounce of gold or silver sold. Management uses this measure to monitor sales of silver and gold ounces against the average market silver and gold prices.
The following table provides a reconciliation of average realized prices to the most directly comparable IFRS measure:
| Three months ended June 30, | Six months ended June 30, | |||||||||||||||||||||||
|---|---|---|---|---|---|---|---|---|---|---|---|---|---|---|---|---|---|---|---|---|---|---|---|---|
| (In thousands except for ounces and per ounce measures) | Q2 2024 | Q2 2023 | Q2 2024 | Q2 2023 | ||||||||||||||||||||
| Silver revenue | $ | 33,645 | $ | 15,284 | $ | 55,368 | $ | 37,914 | ||||||||||||||||
| Silver sold (k oz) | 1,210 | 620 | 2,129 | 1,602 | ||||||||||||||||||||
| Average realized silver price per oz | $ | 27.81 | $ | 24.66 | $ | 26.01 | $ | 23.67 | ||||||||||||||||
| Gold revenue | $ | 36,133 | $ | - | $ | 57,481 | $ | 415 | ||||||||||||||||
| Gold sold (oz) | 15,679 | - | 25,971 | 215 | ||||||||||||||||||||
| Average realized gold price per oz | $ | 2,305 | $ | - | $ | 2,213 | $ | 1,930 | ||||||||||||||||
Andean Precious Metals Corp.Condensed Consolidated Interim Statements of Financial Position (in thousands of US dollars, Unaudited)
| Notes | June 30, 2024 | December 31, 2023 | ||||||||||||
| ASSETS | ||||||||||||||
| Current | ||||||||||||||
| Cash and cash equivalents | $ | 47,049 | $ | 64,907 | ||||||||||
| Marketable securities and short-term investments | 4 | 39,911 | 5,162 | |||||||||||
| Accounts receivables | 2,754 | 888 | ||||||||||||
| Inventories | 5 | 70,060 | 68,391 | |||||||||||
| Other current assets | 6 | 12,963 | 15,251 | |||||||||||
| Total current assets | 172,737 | 154,599 | ||||||||||||
| Non-Current | ||||||||||||||
| Property, plant and equipment | 7 | 97,040 | 92,353 | |||||||||||
| Long term inventory | 5 | 3,058 | 3,047 | |||||||||||
| Deferred income tax asset | 3,970 | 6,156 | ||||||||||||
| Other assets | 6 | 16,035 | 13,735 | |||||||||||
| Total non-current assets | 120,103 | 115,291 | ||||||||||||
| Total assets | $ | 292,840 | $ | 269,890 | ||||||||||
| LIABILITIES | ||||||||||||||
| Current | ||||||||||||||
| Accounts payable and accrued liabilities | 8 | $ | 27,479 | $ | 29,719 | |||||||||
| Current portion of long-term debt | 9 | 8,996 | 8,870 | |||||||||||
| Current income taxes payable | 5,341 | 7,353 | ||||||||||||
| Other liabilities | 10 | 9,477 | 8,294 | |||||||||||
| Total current liabilities | 51,293 | 54,236 | ||||||||||||
| Non-Current | ||||||||||||||
| Long-term debt | 9 | 55,473 | 38,588 | |||||||||||
| Provisions for reclamation | 27,928 | 26,726 | ||||||||||||
| Deferred income tax liability | 16,055 | 13,430 | ||||||||||||
| Other liabilities | 10 | 4,953 | 4,941 | |||||||||||
| Total non-current liabilities | 104,409 | 83,685 | ||||||||||||
| Total liabilities | 155,702 | 137,921 | ||||||||||||
| EQUITY | ||||||||||||||
| Issued capital | 14 | 18,549 | 22,826 | |||||||||||
| Accumulated other comprehensive loss | 390 | 390 | ||||||||||||
| Contributed surplus | 2,459 | 2,322 | ||||||||||||
| Retained earnings | 115,740 | 106,431 | ||||||||||||
| Total equity | 137,138 | 131,969 | ||||||||||||
| Total liabilities and equity | $ 292,840 | $ 269,890 | ||||||||||||
Andean Precious Metals Corp.Condensed Consolidated Interim Statements of Income (Loss) and Comprehensive Income (Loss) (in thousands of US dollars, except per share amounts, unaudited)
| For the three months ended | For the six months ended | ||||||||
| Notes | June 30,2024 | June 30,2023 | June 30,2024 | June 30,2023 | |||||
| Revenues | 11 | $ | 69,779 | $ | 15,284 | $ | 112,849 | $ | 38,329 |
| Cost of sales | 12(a) | (47,847) | (11,771) | (85,126) | (32,988) | ||||
| Depreciation and depletion | 7 | (7,399) | (1,065) | (10,029) | (2,519) | ||||
| Gross Profit | 14,533 | 2,448 | 17,694 | 2,822 | |||||
| General and administrative | 12(b) | (4,339) | (3,120) | (8,887) | (5,575) | ||||
| Exploration and evaluation | (417) | (389) | (649) | 63 | |||||
| Income (loss) from operations | 9,777 | (1,061) | 8,158 | (2,690) | |||||
| Other income | 12(c) | 3,928 | 2,585 | 4,223 | 3,910 | ||||
| Finance costs | 12(d) | (1,624) | (407) | (3,274) | (807) | ||||
| Foreign exchange gain | 3,394 | 1,068 | 5,689 | 1,434 | |||||
| Net income before income taxes | 15,475 | 2,185 | 14,796 | 1,847 | |||||
| Income taxes | |||||||||
| Current income tax expense | 13 | (3,671) | (2,260) | (3,626) | (1,940) | ||||
| Deferred income tax (expense) recovery | 13 | (2,419) | 244 | (1,861) | 481 | ||||
| Net income and comprehensive income | $ | 9,385 | $ | 169 | $ | 9,309 | $ | 388 | |
| Earnings per share | |||||||||
| Basic net income per share | 15 | $ | 0.06 | 0.00 | 0.06 | 0.00 | |||
| Diluted net income per share | 15 | $ | 0.06 | 0.00 | 0.06 | 0.00 | |||
| Weighted average number of common shares outstanding | |||||||||
| Basic | 150,321,629 | 158,474,893 | 151,965,040 | 158,601,832 | |||||
| Diluted | 152,914,066 | 159,480,678 | 154,906,437 | 158,754,705 | |||||
Andean Precious Metals Corp.Condensed Consolidated Interim Statements of Cash Flows(in thousands of US dollars, unaudited)
| Six months ended | |||||
| Notes | June 30, 2024 | June 30, 2023 | |||
| Net income | $ | 9,309 | $ | 388 | |
| Adjustments: | |||||
| Depreciation and depletion | 7 | 10,029 | 2,519 | ||
| Accretion on provision for reclamation | 809 | 671 | |||
| Share-based compensation | 14(b) | 432 | 316 | ||
| Accretion on deferred payment liability | 12(d) | 274 | - | ||
| Loss on disposal of equipment | 337 | - | |||
| Unrealized derivative gain | (2,832) | (972) | |||
| Change in fair value of marketable securities | 4 | (1,624) | 687 | ||
| Reclamation payments | (179) | (89) | |||
| Current income taxes expense | 3,626 | 1,940 | |||
| Deferred income taxes expense (recovery) | 4,811 | (481) | |||
| Foreign exchange gain | (5,689) | (1,434) | |||
| Operating cashflow before changes in non-cash working capital | 19,303 | 3,545 | |||
| Changes in non-cash working capital | 19(a) | (10,996) | (13,161) | ||
| Net cash provided (used in) from operating activities | 8,307 | (9,616) | |||
| Investing activities | |||||
| Expenditures on property, plant and equipment | 7 | (8,610) | (858) | ||
| Net investment in marketable securities and other investments | 4 | (32,944) | (175) | ||
| Net cash used in investing activities | (41,554) | (1,033) | |||
| Financing activities | |||||
| Shares repurchased for cancellations | 14(a) | (4,435) | (1,226) | ||
| Drawn down of line of credit | 9(c) | 15,000 | - | ||
| Payment of debt | 9 | (865) | - | ||
| Proceeds from disposal of marketable securities | - | 139 | |||
| Net cash provided (used in) from financing activities | 9,700 | (1,087) | |||
| Effect of exchange rate changes on cash | 5,689 | 1,434 | |||
| Net decrease in cash during the period | (17,858) | (10,302) | |||
| Cash, beginning of year | 64,907 | 80,729 | |||
| Cash, end of the period | $ | 47,049 | $ | 70,427 | |
To view the source version of this press release, please visit https://www.newsfilecorp.com/release/219828


The new Mining Power Rankings are live. Vote for the sector’s leaders in each of the Large-, Small-, and Micro-Cap leagues.