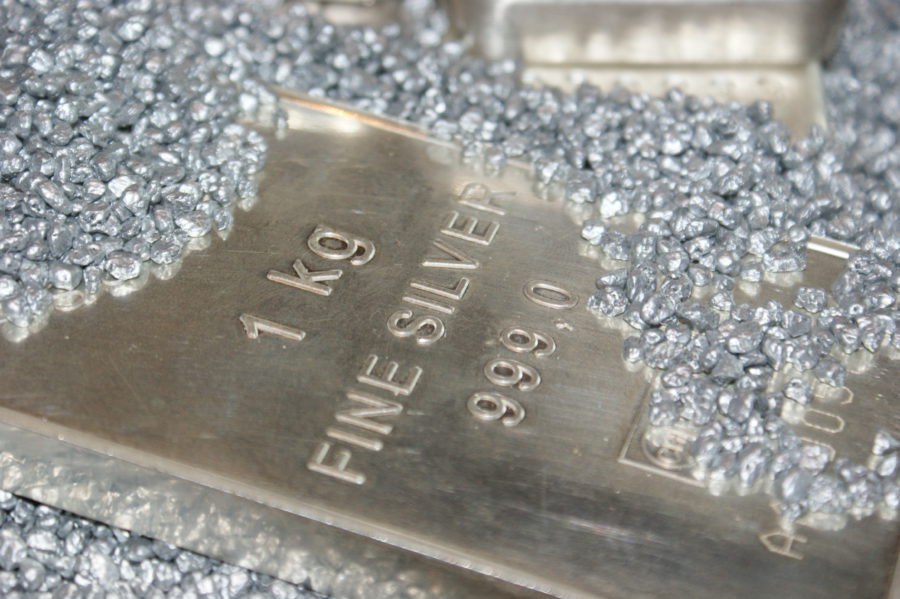
China’s big silver squeeze persists even as prices steady
Domestic producers and traders are struggling to fill a backlog of orders, pushing up near-term prices and leaving the market heavily backwardated.

TORONTO, Aug. 07, 2024 (GLOBE NEWSWIRE) -- McEwen Mining Inc. (NYSE: MUX) (TSX: MUX) today reported its second quarter (Q2) and half year (H1) results for the period ended June 30th, 2024.
“I’m delighted that this quarter was the most profitable since 2016 as measured by Adjusted EBITDA(1) for our mining operations and Q3 is off to a good start. Production costs increased 8% quarter-over-quarter, but revenue grew by 38%. Fox and Gold Bar are capitalizing on the higher gold prices to increase operating cash flow, Gold Bar in particular with its AISC at only $1,400 per GEO in H1. It’s important to note that our net loss continues to be influenced by McEwen Copper and its expenses at Los Azules, which are non-cash as it relates to MUX,” commented Rob McEwen, Chairman and Chief Owner. “McEwen Copper continues to grow in value - based on the most recent injection of capital at $30 per share the implied market value is now $947 million, with MUX owning 48.3% or $457 million. That is 106% of MUX’s current fully diluted market capitalization. In addition, MUX shareowners also get exposure to a 1.25% NSR royalty on Los Azules, our cashflow generating gold-silver mines, and development projects.”
Stronger Financial Results
Our gross profit in Q2 was $10.8 million and our Adjusted EBITDA(1) was $7.2 million, compared to a gross loss of $3.5 million and Adjusted EBITDA of negative $5.8 million in Q2 2023. Higher revenues, driven by a 21% increase in realized gold prices and a 13% increase in GEOs sold drove improvements in gross profit.
After equity accounting for $35.2 million in net expenses incurred by McEwen Copper’s Los Azules project ($16.8 million impact on MUX) we reported a net loss in Q2 of $13.0 million, or $0.26 per share, compared to a net loss of $21.6 million, or $0.46 per share in Q2 2023.
In Q2, we invested $5.0 million in exploration activities at the Grey Fox property and Gold Bar mine. We invested $6.7 million in capital expenditures largely on the Stock Project where earthwork at the portal entrance is expected to be completed in the second half of 2024. An underground ramp will be developed to access the Main, East and West zones of the Stock deposit.
Improved Liquidity and Capital Resources
We reported consolidated cash and cash equivalents of $40.7 million, debt of $40.0 million, and consolidated working capital of $29.1 million as at June 30, 2024. (December 31, 2023 – $23.0 million, $40.0 million and $22.7 million, respectively).
Steady Gold & Silver Production
Production from our three operating mines was 35,265 gold equivalent ounces (GEOs)(2) in Q2, compared to 35,658 GEOs in Q2 2023. Production guidance remains 130,000-145,000 GEOs for 2024.
Through the efforts of our operating teams, we have been steadily improving our production and cash flow while improving our prospects for the future with aggressive exploration drilling.
Attracting and retaining our employees is a constant priority for us as it is for many of our peers, contractors and suppliers.
Individual Mine Performance (See Table 1):
1. Gold Bar produced 12,297 GEOs during Q2, an increase of 56% compared to Q2 2023. Increased mine production from our higher-grade Pick pit facilitated higher production. During H1 2024, we produced 24,013 GEOs at Gold Bar and we are on track to potentially exceed annual production guidance of 40,000 to 43,000 GEOs.
Cash costs and AISC per GEO sold in Q2 were $1,532 and $1,634, respectively, compared to $2,113 and $2,585 in Q2 2023, respectively. The reduction in cash costs and AISC per GEO sold was driven by higher GEOs sold, as noted above.
| Gold Bar Mine($ millions) | Q2 2024 | Q2 2023 | H1 2024 | H1 2023 |
| Revenue from gold sales | 29.7 | 16.0 | 55.0 | 27.6 |
| Cash costs | 19.2 | 17.1 | 32.4 | 26.5 |
| Gross margin | 10.5 | (1.1) | 22.6 | 1.1 |
| Gross margin % | 35.4% | - | 41.1% | 4.0% |
2. Fox has had a challenging first half of the year. At Froome we had a stope fail on the boundary between the ore and the waste, which required us to move out of this area. We are presently formulating a more conservative mining plan to ensure we can optimize future ore extraction. This event decreased stope availability and gold grade processed during the quarter.
Froome is entering its final 18 months of production, focusing on mining areas that are generally smaller in size because they are on the periphery of the ore body, and grades that are generally lower than the main zones extracted over the last two years. We are preparing to meet these challenges as we transition from Froome to Stock, where we anticipate beginning limited production by mid-2025. We have increased throughput at our processing plant by approximately 40% over the last 18 months, growing from 900 tonnes per day (tpd) to over 1,300 tpd.
In Q2, Fox produced 8,297 GEOs, a 20% decrease compared to Q2 2023. During H1 2024, we produced 15,800 GEOs at Fox. While we engaged a mining contractor at the end of Q2 2024 to address development, we expect to be approximately 15-20% below our annual production guidance of 40,000-42,000 GEOs.
Cash costs and AISC per GEO sold were $1,588 and $1,874 in Q2, respectively, compared to $1,237 and $1,371 in Q2 2023, respectively. The increase in unit costs was driven by lower GEOs sold as described above.
| Fox Complex($ millions) | Q2 2024 | Q2 2023 | H1 2024 | H1 2023 |
| Revenue from gold sales | 17.8 | 18.4 | 32.5 | 41.6 |
| Cash costs | 12.9 | 12.5 | 24.7 | 26.5 |
| Gross margin | 4.9 | 5.9 | 7.8 | 15.1 |
| Gross margin % | 27.5% | 32.1% | 24.0% | 36.3% |
3. San José produced 14,672 attributable GEOs during Q2, a 15% decrease compared to Q2 2023. Production was impacted adversely by lower gold grades processed, slightly offset by higher gold recoveries. With 27,605 attributable GEOs produced in H1 2024, San José remains on track to meet annual production guidance of 50,000 to 60,000 attributable GEOs(2).
Cash costs and AISC per GEO sold were $1,624 and $2,032 in Q2, respectively, compared to $1,362 and $1,811 in Q2 2023, respectively. The increase in cash costs and AISC per GEO sold resulted from lower GEOs produced and sold as described above, and foreign exchange impacts of a stronger than expected Argentine Peso.
| San José Mine—100% basis($ millions) | Q2 2024 | Q2 2023 | H1 2024 | H1 2023 |
| Revenue from gold and silver sales | 74.3 | 67.7 | 140.3 | 113.5 |
| Cash costs | 48.2 | 46.9 | 96.1 | 88.1 |
| Gross margin | 26.1 | 20.8 | 44.2 | 25.4 |
| Gross margin % | 35.1% | 30.7% | 31.5% | 22.4% |
Exploration
Exploration results from flow-through funded drilling at the Fox Complex were published in separate press releases on May 27th and June 20th.
Infill and exploration results from Los Azules were published on May 16th. Drilling to support the upcoming Feasibility Study by the end of Q1 2025 is complete and work on the study is progressing as planned.
Timberline Acquisition
On April 16th, 2024, we announced the friendly acquisition of Timberline Resources Corporation for all-share consideration. Timberline’s special meeting to approve the merger will be held on August 16th, 2024.
Benefits to Timberline shareholders include: 1) significant premium, 2) ownership in a growing gold-silver-copper producer focused in the Americas, and 3) participation in the potential acceleration of the development of the Eureka project.
Benefits to MUX shareholders include: 1) acquisition of a gold deposit that is near-term development opportunity complimentary to Gold Bar, 2) addition of a large prospective package of exploration properties, and 3) consolidation of additional land around the Elder Creek property (owned by McEwen Copper).
Any Timberline shareholders who have not yet voted their proxy are encouraged to vote FOR the merger.
Advancing McEwen Copper
We own a 48.3% interest in McEwen Copper Inc., which holds a 100% interest in the Los Azules copper project in San Juan, Argentina, and the Elder Creek exploration project in Nevada, USA. The recent financing by McEwen Copper gave the company a market value of $947.1 million, which means the value of McEwen Mining shareholding has increased to $457.5 million or $8.45 per fully diluted share. McEwen Mining has three classes of assets, its gold and silver mines, its portfolio of six gold, silver and copper royalties and its 48.3% interest in McEwen Copper. Based on the recent financing of McEwen Copper, the implied value of MUX’s ownership in McEwen Copper is approximately 106% of MUX’s current fully diluted market capitalization as at August 7th, 2024.
On July 12, 2024, McEwen Mining and Rob McEwen invested $14 million and $5 million, respectively, as part of the previously announced $70 million McEwen Copper financing at $30 per share (see the June 24, 2024 news release). The balance of the financing is expected to close in Q3 or early Q4 2024.
Milei’s Magic Turbocharging Argentina
The Argentina National Government led by President Milei has recently passed important new legislation designed to support and encourage direct foreign investments in large infrastructure projects including projects like Los Azules. The aim is to create conditions of predictability and legal certainty for large investments, and to create special tax incentives for qualifying strategic sectors.
On July 29th, 2024, it was announced that BHP and Lundin Mining would jointly acquire Filo Corp for approximately $3.1 billion; and form a 50/50 joint venture to develop both the Filo del Sol and Josemaria projects located in the north of San Juan, Argentina. This significant development is an endorsement by the world’s largest mining company of investing in major copper projects in Argentina.
Management Conference Call
Management will discuss our Q2 financial results and project developments and follow with a question-and-answer session. Questions can be asked directly by participants over the phone during the webcast.
| ThursdayAug 8th, 2024 at 11:00 AM EDT | Toll Free Dial-In (US & Canada): | (888) 210-3454 |
| Toll Free Dial-In (Other Countries): | https://events.q4irportal.com/custom/access/2324/ | |
| Toll Dial-In: | (646) 960-0130 | |
| Conference ID Number: | 3232920 | |
| Event Registration Link: | https://events.q4inc.com/attendee/655979798/guest |
An archived replay of the webcast will be available approximately 2 hours following the conclusion of the live event. Access the replay on the Company’s media page at https://www.mcewenmining.com/media.
Table 1 below provides production and cost results for Q2 and H1, with comparative results from Q2 and H1 2023 and our guidance range for 2024.
| Q2 | H1 | Full Year 2024Guidance Range | |||
| 2023 | 2024 | 2023 | 2024 | ||
| Consolidated Production | |||||
| GEOs(2) | 35,658 | 35,265 | 66,022 | 68,320 | 130,000-145,000 |
| Gold Bar Mine, Nevada | |||||
| GEOs | 7,916 | 12,297 | 14,372 | 24,013 | 40,000-43,000 |
| Cash Costs/GEO | 2,113 | 1,532 | 1,842 | 1,313 | $1,450-1,550 |
| AISC/GEO | 2,585 | 1,634 | 2,190 | 1,404 | $1,650-1,750 |
| Fox Complex, Canada | |||||
| GEOs | 10,351 | 8,297 | 23,051 | 15,800 | 40,000-42,000 |
| Cash Costs/GEO | 1,237 | 1,588 | 1,153 | 1,572 | $1,225-1,325 |
| AISC/GEO | 1,371 | 1,874 | 1,337 | 1,886 | $1,450-1,550 |
| San José Mine, Argentina (49%)(3) | |||||
| GEOs | 17,358 | 14,672 | 28,599 | 27,605 | 50,000-60,000 |
| Cash Costs/GEO | $1,362 | 1,624 | $1,537 | 1,615 | $1,300-1,500 |
| AISC/GEO | $1,811 | 2,032 | $1,980 | 1,978 | $1,500-1,700 |
Notes:
Technical Information
The technical content of this news release related to financial results, mining and development projects has been reviewed and approved by William (Bill) Shaver, P.Eng., COO of McEwen Mining and a Qualified Person as defined by SEC S-K 1300 and the Canadian Securities Administrators National Instrument 43-101 "Standards of Disclosure for Mineral Projects."
Reliability of Information Regarding San JoséMinera Santa Cruz S.A., the owner of the San José Mine, is responsible for and has supplied to the Company all reported results from the San José Mine. McEwen Mining’s joint venture partner, a subsidiary of Hochschild Mining plc, and its affiliates other than MSC do not accept responsibility for the use of project data or the adequacy or accuracy of this release.
CAUTIONARY NOTE REGARDING NON-GAAP MEASURES
In this release, we have provided information prepared or calculated according to United States Generally Accepted Accounting Principles (“U.S. GAAP”), as well as provided some non-U.S. GAAP ("non-GAAP") performance measures. Because the non-GAAP performance measures do not have any standardized meaning prescribed by U.S. GAAP, they may not be comparable to similar measures presented by other companies.
Cash Costs and All-in Sustaining CostsCash costs consist of mining, processing, on-site general and administrative costs, community and permitting costs related to current operations, royalty costs, refining and treatment charges (for both doré and concentrate products), sales costs, export taxes and operational stripping costs, and exclude depreciation and amortization. All-in sustaining costs consist of cash costs (as described above), plus accretion of retirement obligations and amortization of the asset retirement costs related to operating sites, sustaining exploration and development costs, sustaining capital expenditures, and sustaining lease payments. Both cash costs and all-in sustaining costs are divided by the gold equivalent ounces sold to determine cash costs and all-in sustaining costs on a per ounce basis. We use and report these measures to provide additional information regarding operational efficiencies on an individual mine basis, and believe that these measures provide investors and analysts with useful information about our underlying costs of operations. A reconciliation to production costs applicable to sales, the nearest U.S. GAAP measure is provided in McEwen Mining's Annual Report on Form 10-K for the year ended December 31, 2023.
| Three months ended June 30, 2024 | Six months ended June 30, 2024 | ||||||||||||||||
| Gold Bar | Fox Complex | Total | Gold Bar | Fox Complex | Total | ||||||||||||
| (in thousands, except per ounce) | (in thousands, except per ounce) | ||||||||||||||||
| Production costs applicable to sales (100% owned) | $ | 19,170 | $ | 12,896 | $ | 32,066 | $ | 32,437 | $ | 24,739 | $ | 57,176 | |||||
| Mine site reclamation, accretion and amortization | 307 | 134 | 442 | 615 | 271 | 885 | |||||||||||
| In‑mine exploration | 507 | — | 507 | 587 | — | 587 | |||||||||||
| Capitalized underground mine development (sustaining) | — | 2,102 | 2,102 | — | 4,405 | 4,405 | |||||||||||
| Capital expenditures on plant and equipment (sustaining) | 428 | — | 428 | 979 | — | 979 | |||||||||||
| Sustaining leases | 32 | 81 | 113 | 53 | 266 | 320 | |||||||||||
| All‑in sustaining costs | $ | 20,444 | $ | 15,213 | $ | 35,658 | $ | 34,671 | $ | 29,681 | $ | 64,352 | |||||
| Ounces sold, including stream (GEO) | 12.5 | 8.1 | 20.6 | 24.7 | 15.7 | 40.4 | |||||||||||
| Cash cost per ounce sold ($/GEO) | $ | 1,532 | $ | 1,588 | $ | 1,554 | $ | 1,313 | $ | 1,572 | $ | 1,414 | |||||
| AISC per ounce sold ($/GEO) | $ | 1,634 | $ | 1,874 | $ | 1,728 | $ | 1,404 | $ | 1,886 | $ | 1,592 | |||||
| Three months ended June 30, 2023 | Six months ended June 30, 2023 | ||||||||||||||||
| Gold Bar | Fox Complex | Total | Gold Bar | Fox Complex | Total | ||||||||||||
| (in thousands, except per ounce) | (in thousands, except per ounce) | ||||||||||||||||
| Production costs applicable to sales - Cash costs (100% owned) | $ | 17,115 | $ | 12,455 | $ | 29,570 | $ | 26,455 | $ | 26,528 | $ | 52,983 | |||||
| In‑mine exploration | 1,115 | — | 1,115 | 1,597 | — | 1,597 | |||||||||||
| Capitalized underground mine development (sustaining) | — | 1,177 | 1,177 | — | 3,831 | 3,831 | |||||||||||
| Capital expenditures on plant and equipment (sustaining) | 2,484 | — | 2,484 | 3,177 | — | 3,177 | |||||||||||
| Sustaining leases | 221 | 176 | 397 | 229 | 399 | 628 | |||||||||||
| All‑in sustaining costs | $ | 20,935 | $ | 13,808 | $ | 34,743 | $ | 31,458 | $ | 30,758 | $ | 62,216 | |||||
| Ounces sold, including stream (GEO) | 8.1 | 10.1 | 18.2 | 14.4 | 23.0 | 37.4 | |||||||||||
| Cash cost per ounce sold ($/GEO) | $ | 2,113 | $ | 1,237 | $ | 1,627 | $ | 1,842 | $ | 1,153 | $ | 1,418 | |||||
| AISC per ounce sold ($/GEO) | $ | 2,585 | $ | 1,371 | $ | 1,912 | $ | 2,190 | $ | 1,337 | $ | 1,665 | |||||
| Three months ended June 30, | Six months ended June 30, | ||||||||||||||
| 2024 | 2023 | 2024 | 2023 | ||||||||||||
| San José mine cash costs (100% basis) | (in thousands, except per ounce) | ||||||||||||||
| Production costs applicable to sales - Cash costs | $ | 48,220 | $ | 46,931 | $ | 96,105 | $ | 88,055 | |||||||
| Mine site reclamation, accretion and amortization | 361 | 95 | 665 | 386 | |||||||||||
| Site exploration expenses | 1,890 | 2,846 | 3,321 | 4,798 | |||||||||||
| Capitalized underground mine development (sustaining) | 7,049 | 8,919 | 14,380 | 16,049 | |||||||||||
| Less: Depreciation | (621 | ) | (703 | ) | (1,420 | ) | (1,253 | ) | |||||||
| Capital expenditures (sustaining) | 3,443 | 4,312 | 4,643 | 5,401 | |||||||||||
| All‑in sustaining costs | $ | 60,342 | $ | 62,400 | $ | 117,694 | $ | 113,436 | |||||||
| Ounces sold (GEO) | 29.7 | 34.4 | 59.5 | 57.3 | |||||||||||
| Cash cost per ounce sold ($/GEO) | $ | 1,624 | $ | 1,362 | $ | 1,615 | $ | 1,537 | |||||||
| AISC per ounce sold ($/GEO) | $ | 2,032 | $ | 1,811 | $ | 1,978 | $ | 1,980 | |||||||
Adjusted EBITDA and adjusted EBITDA per shareAdjusted earnings before interest, taxes, depreciation, and amortization (“Adjusted EBITDA”) is a non-GAAP financial measure and does not have any standardized meaning. We use adjusted EBITDA to evaluate our operating performance and ability to generate cash flow from our wholly owned operations in production; we disclose this metric as we believe this measure provides valuable assistance to investors and analysts in evaluating our ability to finance our precious metal operations and capital activities separately from our copper exploration operations. The most directly comparable measure prepared in accordance with GAAP is net loss before income and mining taxes. Adjusted EBITDA is calculated by adding back McEwen Copper's income or loss impacts on our consolidated income or loss before income and mining taxes.
| Three months ended June 30, | Six months ended June 30, | ||||||||||||||
| 2024 | 2023 | 2024 | 2023 | ||||||||||||
| Adjusted EBITDA | (in thousands) | (in thousands) | |||||||||||||
| Net loss before income and mining taxes | $ | (15,371 | ) | $ | (45,310 | ) | $ | (38,311 | ) | $ | (82,256 | ) | |||
| Less: | |||||||||||||||
| Depreciation and depletion | 4,810 | 8,602 | 15,088 | 15,780 | |||||||||||
| Loss from investment in McEwen Copper Inc. (Note 9) | 16,816 | — | 34,828 | — | |||||||||||
| Advanced Projects – McEwen Copper Inc. | — | 28,524 | — | 60,405 | |||||||||||
| General, interest and other – McEwen Copper Inc. | — | 661 | — | (5,211 | ) | ||||||||||
| Interest expense | 972 | 1,678 | 1,945 | 3,025 | |||||||||||
| Adjusted EBITDA | $ | 7,227 | $ | (5,845 | ) | $ | (48,583 | ) | $ | (17,455 | ) | ||||
| Weighted average shares outstanding (thousands) | 49,718 | 47,428 | 49,580 | 47,428 | |||||||||||
| Adjusted EBITDA per share | $ | 0.15 | $ | (0.12 | ) | $ | (0.98 | ) | $ | (0.37 | ) | ||||
CAUTION CONCERNING FORWARD-LOOKING STATEMENTS
This news release contains certain forward-looking statements and information, including "forward-looking statements" within the meaning of the Private Securities Litigation Reform Act of 1995. The forward-looking statements and information expressed, as at the date of this news release, McEwen Mining Inc.'s (the "Company") estimates, forecasts, projections, expectations or beliefs as to future events and results. Forward-looking statements and information are necessarily based upon a number of estimates and assumptions that, while considered reasonable by management, are inherently subject to significant business, economic and competitive uncertainties, risks and contingencies, and there can be no assurance that such statements and information will prove to be accurate. Therefore, actual results and future events could differ materially from those anticipated in such statements and information. Risks and uncertainties that could cause results or future events to differ materially from current expectations expressed or implied by the forward-looking statements and information include, but are not limited to, fluctuations in the market price of precious metals, mining industry risks, political, economic, social and security risks associated with foreign operations, the ability of the Company to receive or receive in a timely manner permits or other approvals required in connection with operations, risks associated with the construction of mining operations and commencement of production and the projected costs thereof, risks related to litigation, the state of the capital markets, environmental risks and hazards, uncertainty as to calculation of mineral resources and reserves, foreign exchange volatility, foreign exchange controls, foreign currency risk, and other risks. Readers should not place undue reliance on forward-looking statements or information included herein, which speak only as of the date hereof. The Company undertakes no obligation to reissue or update forward-looking statements or information as a result of new information or events after the date hereof except as may be required by law. See McEwen Mining's Annual Report on Form 10-K for the fiscal year ended December 31, 2023, Quarterly Report on Form 10-Q for the three months ended March 31, 2024 and June 30, 2024, and other filings with the Securities and Exchange Commission, under the caption "Risk Factors", for additional information on risks, uncertainties and other factors relating to the forward-looking statements and information regarding the Company. All forward-looking statements and information made in this news release are qualified by this cautionary statement.
The NYSE and TSX have not reviewed and do not accept responsibility for the adequacy or accuracy of the contents of this news release, which has been prepared by the management of McEwen Mining Inc.
ABOUT MCEWEN MINING
McEwen Mining is a gold and silver producer with operations in Nevada, Canada, Mexico and Argentina. In addition, it owns approximately 48% of McEwen Copper which owns the large, advanced stage Los Azules copper project in Argentina. The Company’s objective is to improve the productivity and life of its assets with the goal of increasing its share price and providing an investor yield. Rob McEwen, Chairman and Chief Owner, has a personal investment in the company of US$220 million. His annual salary is US$1.
Want News Fast?
Subscribe to our email list by clicking here:https://www.mcewenmining.com/contact-us/#section=followUs
and receive news as it happens!
| WEB SITE | SOCIAL MEDIA | |||||
| www.mcewenmining.com | McEwen Mining | Facebook: | facebook.com/mcewenmining | |||
| LinkedIn: | linkedin.com/company/mcewen-mining-inc- | |||||
| CONTACT INFORMATION | Twitter: | twitter.com/mcewenmining | ||||
| 150 King Street West | Instagram: | instagram.com/mcewenmining | ||||
| Suite 2800, PO Box 24 | ||||||
| Toronto, ON, Canada | McEwen Copper | Facebook: | facebook.com/ mcewencopper | |||
| M5H 1J9 | LinkedIn: | linkedin.com/company/mcewencopper | ||||
| Twitter: | twitter.com/mcewencopper | |||||
| Relationship with Investors: | Instagram: | instagram.com/mcewencopper | ||||
| (866)-441-0690 - Toll free line | ||||||
| (647)-258-0395 | Rob McEwen | Facebook: | facebook.com/mcewenrob | |||
| Mihaela Iancu ext. 320 | LinkedIn: | linkedin.com/in/robert-mcewen-646ab24 | ||||
| [email protected] | Twitter: | twitter.com/robmcewenmux | ||||


The new Mining Power Rankings are live. Vote for the sector’s leaders in each of the Large-, Small-, and Micro-Cap leagues.