TORONTO, Aug. 7, 2024 /CNW/ - Mandalay Resources Corporation ("Mandalay" or the "Company") (TSX: MND) (OTCQB: MNDJF) is pleased to announce strong financial results for the second quarter ended June 30, 2024 supported by solid production results, disciplined capital allocation, and favorable metal prices.
The Company's condensed and consolidated interim financial result for the quarter ended June 30, 2024, together with its Management's Discussion and Analysis ("MD&A") for the corresponding period, can be accessed under the Company's profile on www.sedar.com and on the Company's website at www.mandalayresources.com. All currency references in this press release are in U.S. dollars except as otherwise indicated.
Second Quarter 2024 Highlights:
- Continued strengthening of balance sheet with cash balance of $62.9 million as at June 30, 2024 and a growing net cash position[1] of $35.8 million;
- Generated $24.1 million and $15.6 million in cash flow from operating activities and free cash flow1, respectively;
- Consolidated revenue up by 59% as compared to Q2 2023, at $63.1 million;
- Björkdal recorded its highest ever quarterly revenue of $28.8 million;
- Costerfield generated $34.3 million in quarterly revenue;
- Consolidated cash operating cost1 per gold equivalent ounce produced decreased by 12% to $1,022 per ounce in Q2 2024 compared to $1,159 per ounce in Q2 2023;
- All-in sustaining cost1 per gold equivalent ounce produced decreased by 17% to $1,419 per ounce in Q2 2024 compared to $1,704 per ounce in Q2 2023; and
- Consolidated net income was $15.9 million ($0.17 or C$0.23 per share), compared to $0.5 million in Q2 2023.
Subsequent to the quarter end, based on the Company's strong quarter-end cash position and ongoing cash flow expectations, Mandalay repaid the entire outstanding balance ($20 million) of its Revolving Credit Facility. As a result, Mandalay currently has no indebtedness other than minor equipment leases. The undrawn $35 million Revolving Credit Facility remains in place.
Frazer Bourchier, President, and CEO commented:
"In the second quarter, we again delivered revenue and earnings growth, driven by solid production results and a stable cost profile that met our internal plans. Based on our strong quarter-end cash position of approximately $63 million and anticipated future cash flow generation, we have fully repaid the remaining $20 million balance on our Revolving Credit Facility, leaving us with $35 million in undrawn availability under the facility. We will keep proactively managing our balance sheet to increase our financial flexibility."
____________________________
|
1.
| Gold equivalent production, adjusted EBITDA, free cash flow, net cash, cash operating costs and all-in sustaining costs are non-GAAP financial performance measures with no standard definition under IFRS. Refer to "Non-GAAP Financial Performance Measures" at the end of this press release for further information.
|
Hashim Ahmed, CFO commented:
"On a consolidated basis, the Company generated $15.6 million in free cash flow during Q2 2024, equating to approximately $582 per ounce of gold equivalent sold. This was supported by an increase in cash flow from operating activities during the same period, amounting to $24.1 million by the end of Q2 2024. As compared with the previous quarter, Mandalay's cash balance rose by approximately $16 million with an ending net cash position of $35.8 million in Q2 2024.
"Our consolidated cash and all-in sustaining costs per ounce of gold equivalent produced during Q2 2024 were $1,022 and $1,419, respectively, marking a decrease compared to the corresponding quarter last year, primarily due to increased gold equivalent production.
"Björkdal achieved its highest quarterly revenue, nearing $29 million. This was primarily driven by increased tonnage processed in Q2 2024, as compared to the same period last year. Meanwhile, Costerfield recorded its third consecutive quarter-over-quarter revenue increase reaching $34.3 million."
Mr. Bourchier concluded: "Mandalay made substantial progress in strengthening its balance sheet during the first half of the year. We are executing well on our operational strategic priorities and remain on track to achieve our annual production guidance, while continuing to take steps to further optimize our operations for better sustained cash flow generation, positioning the Company for long-term growth and increased shareholder value."
Second Quarter 2024 Financial Summary
The following table summarizes the Company's consolidated financial results for the three and six months ended June 30, 2024 and 2023:
($ thousands, except where indicated)
| Three months ended
| Six months ended
|
June 30,
| June 30,
|
| 2024
| 2023
| 2024
| 2023
|
Revenue
| 63,054
| 39,670
| 118,565
| 81,849
|
Cost of sales
| 25,162
| 29,236
| 52,193
| 55,842
|
Adjusted EBITDA (1)
| 35,862
| 8,890
| 62,597
| 21,835
|
Adjusted net income (loss) (1)
| 16,802
| (3,229)
| 28,954
| (2,711)
|
Consolidated net income
| 15,857
| 524
| 21,745
| 1,078
|
Capital expenditure
| 8,791
| 14,095
| 21,937
| 22,872
|
Total assets
| 323,272
| 271,324
| 323,272
| 271,324
|
Total liabilities
| 109,244
| 91,001
| 109,244
| 91,001
|
Adjusted net income (loss) per share (1)
| 0.18
| (0.03)
| 0.31
| (0.03)
|
Consolidated net income per share
| 0.17
| 0.01
| 0.23
| 0.01
|
1.
| Adjusted EBITDA, adjusted net income and adjusted net income per share are non-GAAP financial performance measures with no standard definition under IFRS. Refer to "Non-GAAP Financial Performance Measures" at the end of this press release for further information.
|
In Q2 2024, Mandalay generated consolidated revenue of $63.1 million, 59% higher than the second quarter of 2023. The increase in revenue was due to an increase in gold production contributing to higher gold equivalent ounces sold of 26,759 ounces in Q2 2024 as compared to 20,229 ounces in Q2 2023 together with higher average realized prices: $2,314 per ounce for gold and $20,320 per tonne for antimony in Q2 2024 compared to $1,949 per ounce and $12,406 per tonne in Q2 2023.
Consolidated cash operating cost per ounce of gold equivalent produced decreased 12% to $1,022 per ounce in the second quarter of 2024 compared to $1,159 in the second quarter of 2023. The decrease in cash operating cost per ounce was due to a 26% increase of gold equivalent production in Q2 2024 with 26,372 ounces produced compared to 20,850 ounces in Q2 2023, partly offset by a 12% increase in cash operating costs. The increase in cash operating costs was primarily due to higher processing costs at both sites during Q2 2024 compared to Q2 2023 due to increased throughput at Björkdal and increased costs for tailings and water management at Costerfield coupled with increased personnel expenses during Q2 2024, which stemmed from understaffing due to recruitment challenges in Q2 2023.
Cost of sales including change in inventory during the second quarter of 2024 versus the second quarter of 2023 were $4.8 million lower at Costerfield due a higher build-up of inventory partly offset by the higher cash operating costs and $0.7 million higher at Björkdal. Consolidated general and administrative costs were $0.5 million higher compared to the second quarter of 2023.
Mandalay generated adjusted EBITDA of $35.9 million in the second quarter of 2024, which is four times higher than the adjusted EBITDA in the second quarter of 2023. The increase in adjusted EBITDA was mainly due to higher revenue in the current quarter. Adjusted net income was $16.8 million in the second quarter of 2024, which excludes a $0.9 million loss on financial instruments, compared to an adjusted net loss of $3.2 million in the second quarter of 2023.
Consolidated net income was $15.9 million for the second quarter of 2024, versus $0.5 million in the second quarter of 2023. Mandalay ended the second quarter of 2024 with $62.9 million in cash and cash equivalents.
Second Quarter Operational Summary
The table below summarizes the Company's operations, capital expenditures and operational unit costs for the three and six months ended June 30, 2024 and 2023:
| Three months ended
| Six months ended
|
June 30,
| June 30,
|
| 2024
| 2023
| 2024
| 2023
|
Costerfield
| | | | |
Gold produced (oz)
| 11,027
| 7,296
| 23,003
| 14,664
|
Antimony produced (t)
| 359
| 517
| 763
| 1,061
|
Gold equivalent produced (oz)
| 13,773
| 10,453
| 28,339
| 21,470
|
Cash operating cost (1) per oz gold eq. produced ($)
| 844
| 930
| 811
| 925
|
All-in sustaining cost (1) per oz gold eq. produced ($)
| 1,142
| 1,268
| 1,072
| 1,190
|
Capital development
| 1,023
| 983
| 1,877
| 1,848
|
Property, plant and equipment purchases
| 1,291
| 1,089
| 2,144
| 1,597
|
Capitalized exploration
| 2,281
| 1,968
| 4,228
| 4,120
|
Björkdal
| | | | |
Gold produced (oz)
| 12,599
| 10,397
| 22,969
| 19,366
|
Cash operating cost (1) per oz gold produced ($)
| 1,216
| 1,389
| 1,300
| 1,483
|
All-in sustaining cost (1,3) per oz gold produced ($)
| 1,553
| 1,978
| 1,695
| 1,959
|
Capital development
| 2,110
| 2,761
| 4,791
| 4,569
|
Property, plant and equipment purchases
| 1,296
| 5,743
| 2,704
| 8,327
|
Capitalized exploration
| 1,013
| 1,551
| 1,612
| 2,344
|
Consolidated
| | | | |
Gold equivalent produced (oz)
| 26,372
| 20,850
| 51,308
| 40,836
|
Cash operating cost (1) per oz gold eq. produced ($)
| 1,022
| 1,159
| 1,030
| 1,190
|
All-in sustaining cost (1,3) per oz gold eq. produced ($)
| 1,419
| 1,704
| 1,427
| 1,663
|
Capital development
| 3,133
| 3,744
| 6,668
| 6,417
|
Property, plant and equipment purchases (2)
| 2,364
| 6,832
| 9,372
| 9,924
|
Capitalized exploration
| 3,294
| 3,519
| 5,897
| 6,531
|
1.
| Cash operating cost and all-in sustaining cost are non-GAAP financial performance measures with no standard definition under IFRS. Refer to "Non-GAAP Financial Performance Measures" at the end of this press release for further information.
|
2.
| includes equipments purchased for reclamation activities at non-operating site.
|
3.
| All-in sustaining costs in the current year includes tailings dam amortization, accordingly the 2023 comparative figures have been updated.
|
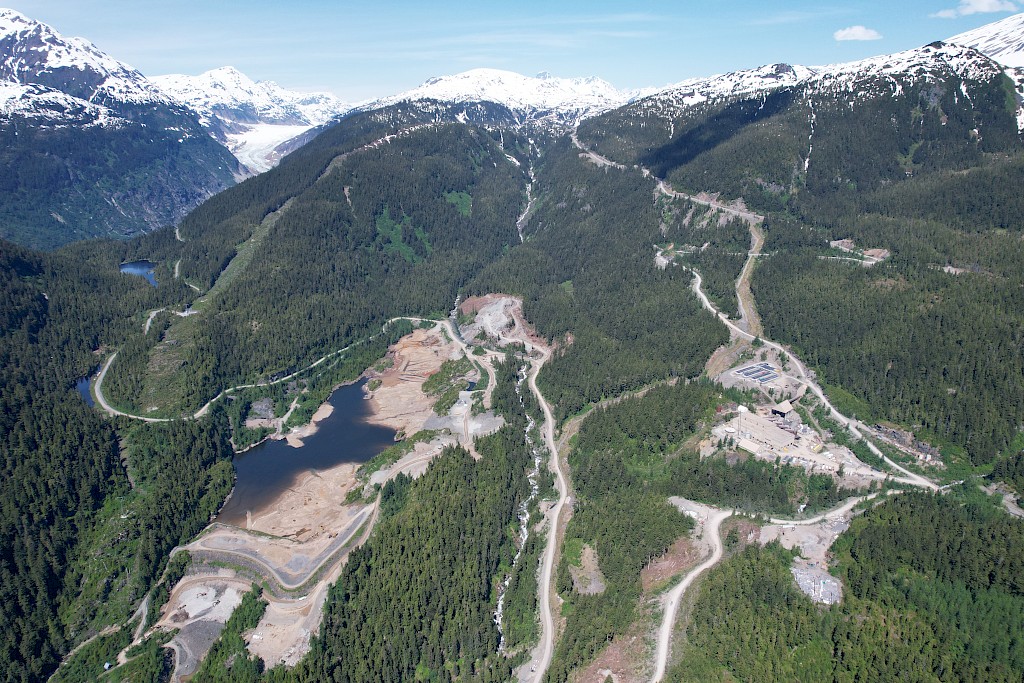
Costerfield gold-antimony mine, Victoria, Australia
During Q2 2024, Costerfield produced 11,027 ounces of gold compared to 7,296 ounces in Q2 2023, an increase of 51% or 3,731 ounces. The increase in ounces produced was a result of an increase in the average milled gold head grade from 7.39 g/t in Q2 2023 to 12.07 g/t in Q2 2024. Costerfield generated $34.3 million in revenue and $23.5 million in adjusted EBITDA, which resulted in net income of $12.3 million.
The cash operating cost per ounce of gold equivalent produced decreased by 9% to $844 per ounce in Q2 2024 compared to $930 in Q2 2023, and all-in sustaining cost per ounce of gold equivalent produced decreased by 10% to $1,142 per ounce in Q2 2024 compared to $1,268 Q2 2023, both mainly as a result of the increased gold equivalent production partly offset by increased cash operating costs mainly due to increased processing costs due to higher costs for tailings and water management coupled with increased personnel costs both in the mine and the mill during Q2 2024, which stemmed from understaffing due to recruitment challenges in Q2 2023 and higher mining materials costs due to unplanned spending to reinforce production areas during Q2 2024.
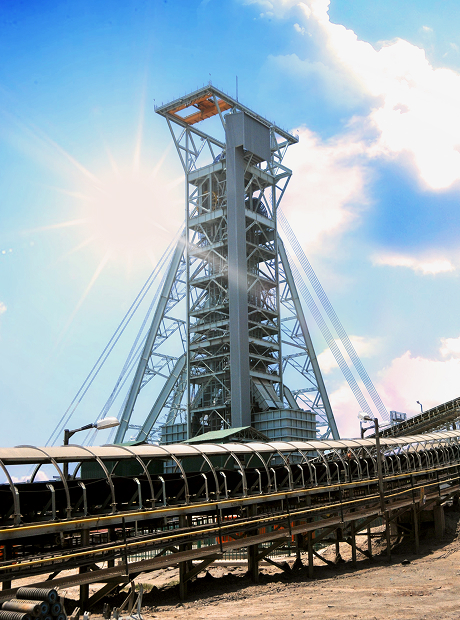
Björkdal gold mine, Skellefteå, Sweden
During Q2 2024, Björkdal produced 12,599 ounces of gold compared to 10,397 ounces in Q2 2023, an increase of 21% or 2,202 ounces, mainly due to the 12% increase in the tonnes of ore processed from 296,213 in Q2 2023 to 331,450 in Q2 2024. Björkdal generated $28.8 million in revenue and $14.3 million in adjusted EBITDA, which resulted in net income of $5.0 million.
The cash operating cost per ounce produced for Q2 2024 decreased by 12% to $1,216 per ounce compared to $1,389 in Q2 2023 as a result of the increased gold production partly offset by increased cash operating costs mainly due to higher throughput post the commissioning of the mill conversion capital investment project in Q1 2024 resulting in increased consumption of grinding media and other mill consumables. All-in sustaining cost per ounce decreased by 21% to $1,553 per ounce, compared to $1,978 in Q2 2023 as a result of the increased gold production coupled with lower sustaining capital spending partly offset by the increased cash operating costs.
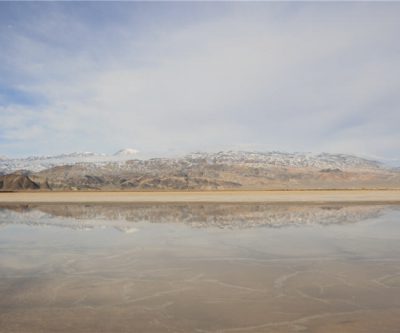
Lupin, Nunavut, Canada
Care and maintenance spending at Lupin was less than $0.1 million during Q2 2024 and Q2 2023. Reclamation spending at Lupin was $0.5 million during Q2 2024 compared to less than $0.1 million in Q2 2023. There will be increased reclamation spend in the remaining year 2024 at Lupin relative to the 2023 year, but the majority of this reclamation work to achieve the majority of closure obligations, is expected to take place in the 2025 calendar year. Lupin is currently in the process of final closure and reclamation activities, which are partly funded by progressive security reductions held by the Crown Indigenous Relations and Northern Affairs Canada.
La Quebrada, Chile
No work was carried out on the La Quebrada development property during Q2 2024.
Conference Call
A conference call with Frazer Bourchier, President and Chief Executive Officer of Mandalay, for investors and analysts on August 8, 2024, at 8:00 AM (Toronto time). Interested investors may join by using the following dial-in number:
Participant Number (North America toll free):
| 1-800-836-8184
|
Conference ID:
| 94411
|
Alternatively, please register for the webcast here. A replay of the conference call will be available until 11:59 PM (Toronto time), August 15, 2024, and can be accessed using the following dial-in numbers:
Encore Number (Canada Toll free):
| 1-888-660-6345
|
Encore Replay Code:
| 94411#
|
About Mandalay Resources Corporation
Mandalay Resources is a Canadian-based natural resource company with producing assets in Australia (Costerfield gold-antimony mine) and Sweden (Björkdal gold mine). The Company is focused on growing its production and reducing costs to generate significant positive cashflow. Mandalay is committed to operating safely and in an environmentally responsible manner, while developing a high level of community and employee engagement.
Mandalay's mission is to create shareholder value through the profitable operation and regional exploration programs, at both its Costerfield and Björkdal mines. Currently, the Company's main objectives are to continue mining the high-grade Youle and Shepherd veins at Costerfield, and to extend Mineral Reserves. At Björkdal, the Company will aim to increase production from the Eastern Extension area and other higher-grade areas in the coming years, in order to maximize profit margins from the mine.
Forward-Looking Statements
This news release contains "forward-looking statements" within the meaning of applicable securities laws, including statements regarding the Company's anticipated performance in 2024. Readers are cautioned not to place undue reliance on forward-looking statements. Actual results and developments may differ materially from those contemplated by these statements depending on, among other things, changes in commodity prices and general market and economic conditions. The factors identified above are not intended to represent a complete list of the factors that could affect Mandalay. A description of additional risks that could result in actual results and developments differing from those contemplated by forward-looking statements in this news release can be found under the heading "Risk Factors" in Mandalay's annual information form dated March 31, 2024, a copy of which is available under Mandalay's profile at www.sedar.com. In addition, there can be no assurance that any inferred resources that are discovered as a result of additional drilling will ever be upgraded to proven or probable reserves. Although Mandalay has attempted to identify important factors that could cause actual actions, events or results to differ materially from those described in forward-looking statements, there may be other factors that cause actions, events or results not to be as anticipated, estimated or intended. There can be no assurance that forward-looking statements will prove to be accurate, as actual results and future events could differ materially from those anticipated in such statements. Accordingly, readers should not place undue reliance on forward-looking statements.
Non-GAAP Performance Measures
This news release may contain references to adjusted EBITDA, adjusted net income, free cash flow, cash operating cost per ounce of gold equivalent produced and all-in sustaining cost all of which are non-GAAP performance measures and do not have standardized meanings under IFRS. Therefore, these measures may not be comparable to similar measures presented by other issuers.
Management uses adjusted EBITDA and free cash flow as measures of operating performance to assist in assessing the Company's ability to generate liquidity through operating cash flow to fund future working capital needs and to fund future capital expenditures, as well as to assist in comparing financial performance from period to period on a consistent basis. Management uses adjusted net income in order to facilitate an understanding of the Company's financial performance prior to the impact of non-recurring or special items. The Company believes that these measures are used by and are useful to investors and other users of the Company's financial statements in evaluating the Company's operating and cash performance because they allow for analysis of its financial results without regard to special, non-cash and other non-core items, which can vary substantially from company to company and over different periods.
The Company defines adjusted EBITDA as income from mine operations, net of administration costs, and before interest, taxes, non-cash charges/(income), intercompany charges and finance costs. The Company defines adjusted net income as net income before special items. Special items are items of income and expense that are presented separately due to their nature and, in some cases, expected infrequency of the events giving rise to them. A reconciliation between adjusted EBITDA and adjusted net income, on the one hand, and consolidated net income, on the other hand, is included in the MD&A.
The Company defines free cash flow as a measure of the Company's ability to generate and manage liquidity. It is calculated starting with the net cash flows from operating activities (as per IFRS) and then subtracting capital expenditures and lease payments. Refer to "Non-GAAP Financial Performance Measures" section of the MD&A for a reconciliation between free cash flow and net cash flows from operating activities.
For Costerfield, equivalent gold ounces produced is calculated by adding to gold ounces produced, the antimony tonnes produced times the average antimony price in the period divided by the average gold price in the period. The total cash operating cost associated with the production of these equivalent ounces produced in the period is then divided by the equivalent gold ounces produced to yield the cash operating cost per equivalent ounce produced. The cash operating cost excludes royalty expenses. Site all-in sustaining costs include total cash operating costs, sustaining mining capital, royalty expense, accretion of reclamation provision and tailings dam amortization. Sustaining capital reflects the capital required to maintain each site's current level of operations. The site's all-in sustaining cost per ounce of gold equivalent in a period equals the all-in sustaining cost divided by the equivalent gold ounces produced in the period.
For Björkdal, the total cash operating cost associated with the production of gold ounces produced in the period is then divided by the gold ounces produced to yield the cash operating cost per gold ounce produced. The cash operating cost excludes royalty expenses. Site all-in sustaining costs include total cash operating costs, sustaining mining capital, royalty expense, accretion of reclamation provision and tailings dam amortization. Sustaining capital reflects the capital required to maintain each site's current level of operations. The site's all-in sustaining cost per ounce of gold equivalent in a period equals the all-in sustaining cost divided by the equivalent gold ounces produced in the period.
For the Company as a whole, cash operating cost per gold equivalent ounce is calculated by summing the gold equivalent ounces produced by each site and dividing the total by the sum of cash operating costs at the sites. Consolidated cash operating cost excludes royalty and corporate level general and administrative expenses. This definition was updated in the third quarter of 2020 to exclude corporate general and administrative expenses to better align with industry standard. All-in sustaining cost per ounce gold equivalent in the period equals the sum of cash operating costs associated with the production of gold equivalent ounces at all operating sites in the period plus corporate overhead expense in the period plus sustaining mining capital, royalty expense, accretion of reclamation provision and tailings dam amortization, divided by the total gold equivalent ounces produced in the period. A reconciliation between cost of sales and cash operating costs, and also cash operating cost to all-in sustaining costs are included in the MD&A.
![]() View original content to download multimedia:https://www.prnewswire.com/news-releases/mandalay-resources-delivers-strong-second-quarter-2024-financial-results-leading-to-63-million-cash-balance-302217245.html
View original content to download multimedia:https://www.prnewswire.com/news-releases/mandalay-resources-delivers-strong-second-quarter-2024-financial-results-leading-to-63-million-cash-balance-302217245.html
SOURCE Mandalay Resources Corporation
![]()
![]() View original content to download multimedia: http://www.newswire.ca/en/releases/archive/August2024/07/c8349.html
View original content to download multimedia: http://www.newswire.ca/en/releases/archive/August2024/07/c8349.html