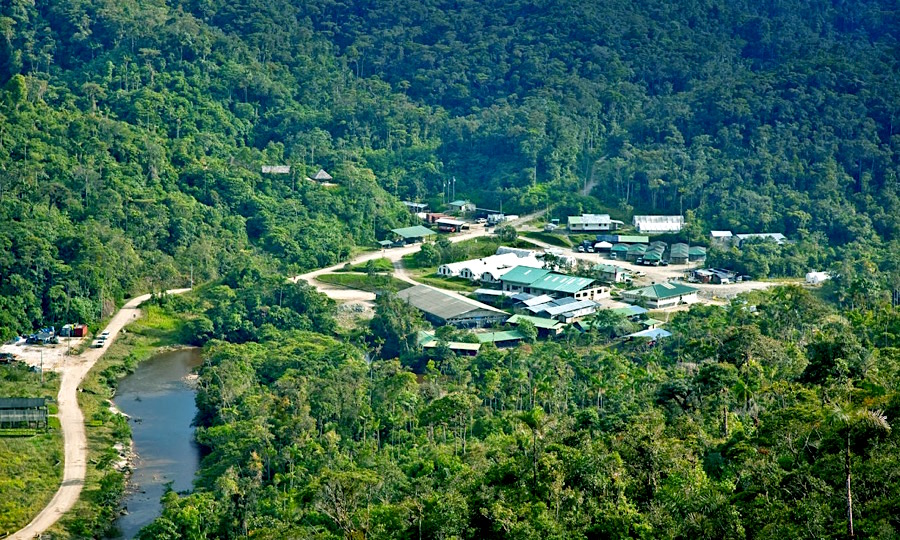
Gold’s 200-Day Moving Average Climbs Above $1,100

Gold declined in fits and starts all through Far East and London trading on Wednesday… and then got hit pretty hard going into the London p.m. gold fix at 10:00 a.m. New York time.  That was gold’s low for the day at $1,212.90 spot.  From the p.m. fix, gold rallied about $11 before running into a resolute seller… and closed in after hours trading down about a dollar from Tuesday’s close.  Volume was extremely light  Thursday’s trading activity is the red line on this chart.

Silver’s price was more or less steady throughout Far East and London trading but, it too, got smacked at the Comex open in New York… with the absolute low price [$18.07 spot] coming at 9:00 a.m. Eastern time right on the button.  From that low, silver struggled back and finished electronic trading down 7 cents from Tuesday’s close.  Silver’s trading volume yesterday was not light… but it was certainly lower than average.  Once again, the red trace is Wednesday’s trading.

The dollar didn’t do much yesterday… hovering within about 20 basis points of 86.8 cents… so it’s pretty obvious that the major price moves in New York had nothing to do with the dollar… and everything to do with the bullion banks.  Here’s the 2-day dollar chart.

The HUI’s low of the day was shortly before 10:00 a.m. in New York trading… and moments before the London p.m. gold fix.  Although the HUI finished positive on the day, the chart indicates [at least to me] that yesterday’s price action in the precious metals shares had more to do with the big rally in the general equity markets then the action in the gold price.  The HUI finished up 1.96% on the day… and it was mostly the large cap gold stocks that did well.

I must admit that when I see the shares up this amount when both gold and silver have been down big during the day, I wonder in the back of mind it if isn’t ‘da boyz’ buying gold and silver shares to save for a rainy day when they want to sell them to force a really bad down-day in the precious metals shares.  John Embry over at Sprott Asset Management is convinced that they do… and there are plenty of occasions when I won’t argue with him on that score.

The CME Delivery Report showed that 80 gold and 2 silver contracts were posted for delivery on Friday.  The link to the action is here.  GLD reported another tiny increase in their gold inventory.  This time it was 9,783 ounces… and the SLV ETF had no report.  The U.S. Mint reported selling another 2,000 one-ounce gold eagles and 3,000 24-k gold buffaloes yesterday.  They reported no sales in silver eagles.  In the first two days of June, the mint has sold 8,000 one-ounce gold eagles… 8,000 24-k gold buffaloes… and 509,000 silver eagles.  The Comex-approved depositories reported receiving a smallish 61,655 ounces of silver on Tuesday.

Sponsor Advertisement
Toronto-based Inter-Citic Minerals Inc. (TSX: ICI) is a gold exploration and development company, developing what could be one of China’s largest open-pit gold deposits. Inter-Citic’s 279 sq km Dachang Gold Project in Qinghai Province, China, with 50,000 meters of drilling underway in 2008.

The total NI 43-101 compliant Inferred Mineral Resource Estimate at Dachang now stands at 2.9 million oz Au contained (approximately 25 million tonnes with an average grade of 3.6 gpt Au), with more drilling underway on the DMZ to further define the existing 43-101 inferred mineral resource estimate in preparation for a scoping study, as well as additional drilling in highly prospective new areas focused on resource expansion. Gold mineralization in the Dachang Main Zone begins at surface and has not been significantly drilled below 150 meters, and numerous known areas of surface gold mineralization on adjacent and other parts of the property have the potential for further discoveries. The Dachang Main Zone itself remains open at depth and along strike.

Under a 30-year joint venture agreement with the Qinghai Geological Survey Institute (QGSI – the provincial geological survey body), Inter-Citic has a fully-vested 83% interest in the property, with 17% belonging to QGSI. Inter-Citic has a further option to increase its total interest to 90% at pre-feasibility. The Dachang property consists of several exploration license areas. They have all been renewed by the Company as they have come due in regular course. The business license for the Dachang Gold Project is currently valid to December 26, 2033.

Learn more here.

My first gold story is a Bloomberg piece filed from Beijing… and posted atbusinessweek.com last Saturday.  The headline reads “Gold a ‘Good Choice’ for Boosting Global Use of Yuan“.  I thank reader Danny Cheung for sharing it… and the link is here.

The next gold-related story was one that I lifted from Bill Murphy over atlemetropolecafe.com yesterday.  It’s a piece posted at miningmx.com… and it bears the headline “South African gold output falls hard“.  The South African Chamber of Mines reported the country’s first quarter gold production fell 15% quarter-on-quarter, extending the downward slide in output.  But, dear reader, there’s much more information in this story than just the headline… and I urge you to run through it… and it’s not very long.  The link is here.

My last two stories are courtesy of reader Scott Pluschau.  The first is posted over at cnbc.com… and the headline reads “NY Nearly Goes Broke Again, Delays Paying Bills“.  This is the third time since December [that] the cash-poor state has withheld funds. The link to the story is here.

This last gold story was posted over at Reuters yesterday.  It’s a very short piece… and the headline pretty much says it all… “Iran to sell €45 billion, buy dollars, gold – Xinhua“.  This story will take all of 30 seconds to read… and the link is here.

Well, it was pretty much just another day off the calendar yesterday.  Tuesday’s 122 point drop in the Dow is now a distant memory after the Dow’s rampage yesterday, which sent the index climbing 225 points.  The bourses in Thursday’s Far East and European trading are rejoicing at the moment… and the futures have already been spun higher for today’s New York opening.

I found a couple of items of interest that I haven’t heard any other commentator mention… and that’s the fact that gold’s 200-day moving average is now over $1,100 the ounce.  That’s rather impressive considering the fact that the 200-day moving average for gold broke through the $1,000 level just six months ago.  Here’s the chart.

Not to be outdone… silver’s 200-day moving average is now well over $17.00 the ounce… and this moving average hasn’t been this high for almost 30 years when silver went on its Hunt Brothers-inspired rampage.  Here’s the 3-year silver graph.

Gold volume this morning at 4:29 a.m. Eastern time is microscopic… only 8,600 contracts traded… and silver’s volume is only 2,200 contracts.  This is air and, with these volume levels, it doesn’t take a lot to push the price around in either direction.  Based on that, you can’t read a thing into Far East and early London trading this morning.  But as you already know, dear reader, the real price movements occur in New York… and I expect today’s Comex action to show that again today.

I hope your Thursday goes well… and I’ll see you here on Friday.