Gold, silver and copper had a banner first half
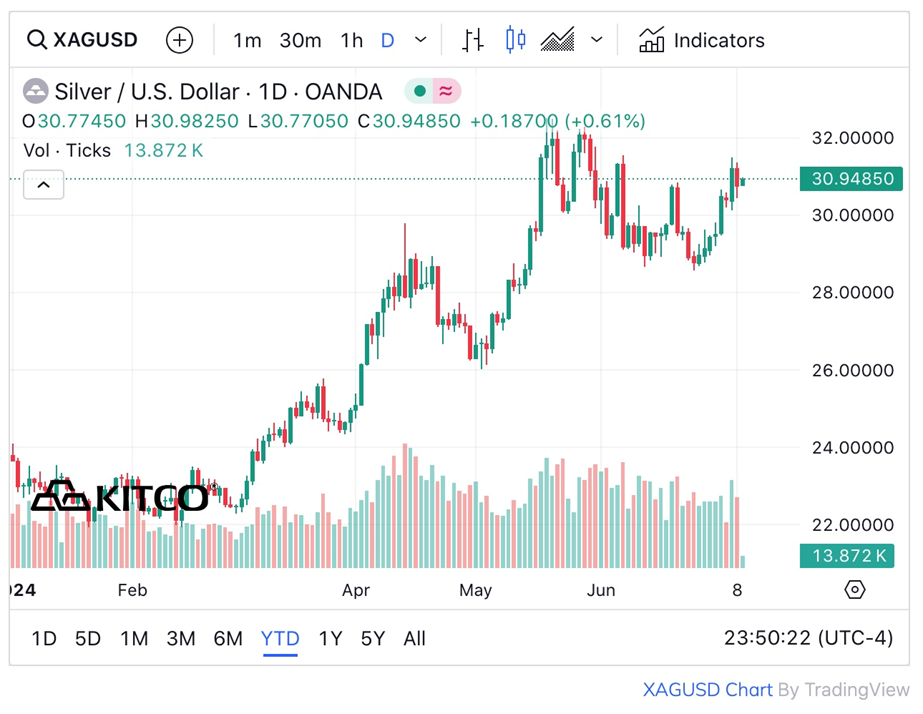
Silver is up 33% year to date (July 8), gold is up 15.8%, and copper has gained 19.1%.


Back in December, we predicted that in 2024, commodities would see ‘a perfect storm of higher prices’.
At the half-year mark, it appears that our prediction was bang-on.
While gold and silver prices were down on Monday, July 8, the outlook for precious metals is good, as for industrial metals including copper due to impending Fed interest rate cuts, at least one by year’s end.
The yellow metal reached $2,393/oz on Friday following the release of US NonFarm Payrolls Data. The weaker labor market and rising unemployment rate, which hit 4.1% in June, is fodder for the US Federal Reserve to slash interest rates, possibly once in September and a second time in December.
“We now have definitive evidence of labour market cooling with a somewhat alarming rise in the unemployment rate in recent months that should give policymakers ‘more confidence’ that consumer inflation will soon return to the 2.0 per cent target on a sustainable basis,” said Scott Anderson, chief US economist at BMO Capital Markets, via The Globe and Mail.
In remarks to Congress, Fed Chair Jerome Powell said the US is “no longer an overheated economy” with a job market that has “cooled considerably” and is back where it was before the pandemic, suggesting the potential for rate cuts is becoming stronger. (Reuters, July 9, 2024)
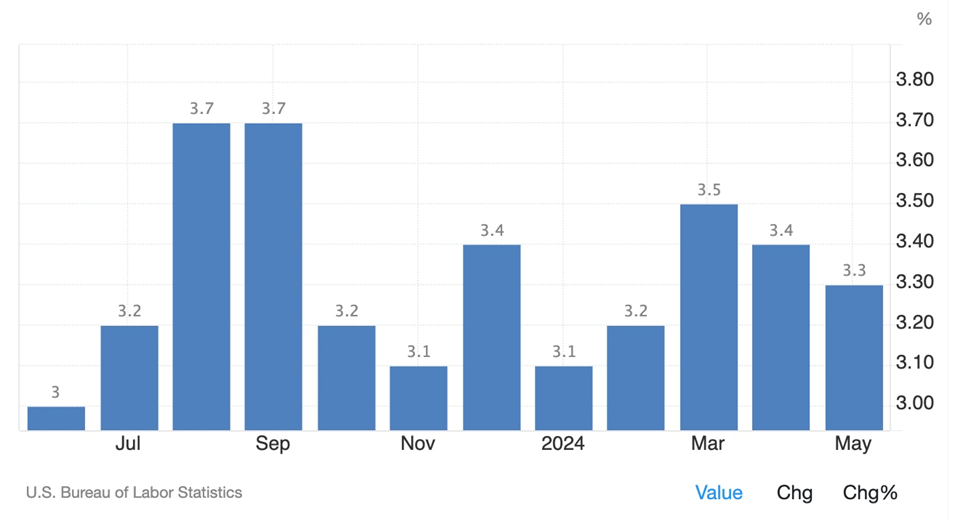
Powell told senators that inflation has been improving in recent months. The chart below shows the annual inflation rate slowed to 3.3% in May, compared to 3.4% in April and 3.5% in March.
What’s driving commodities?
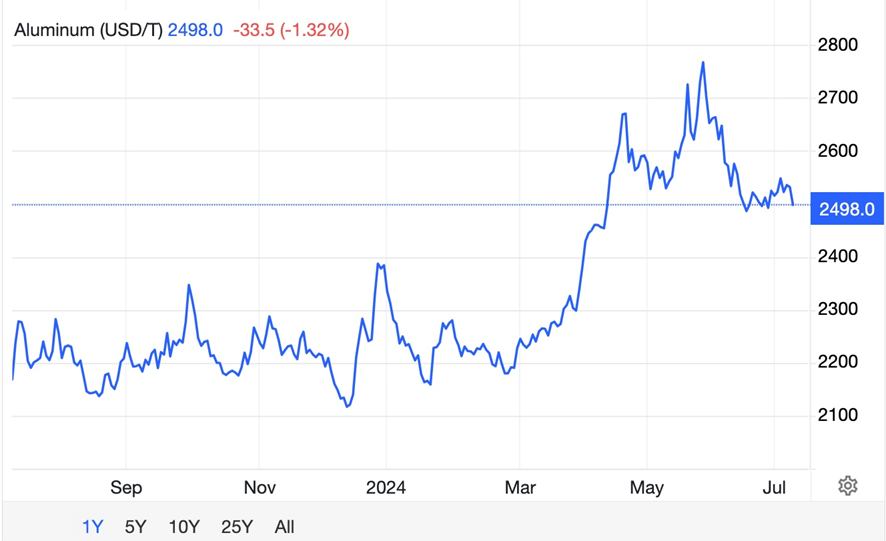
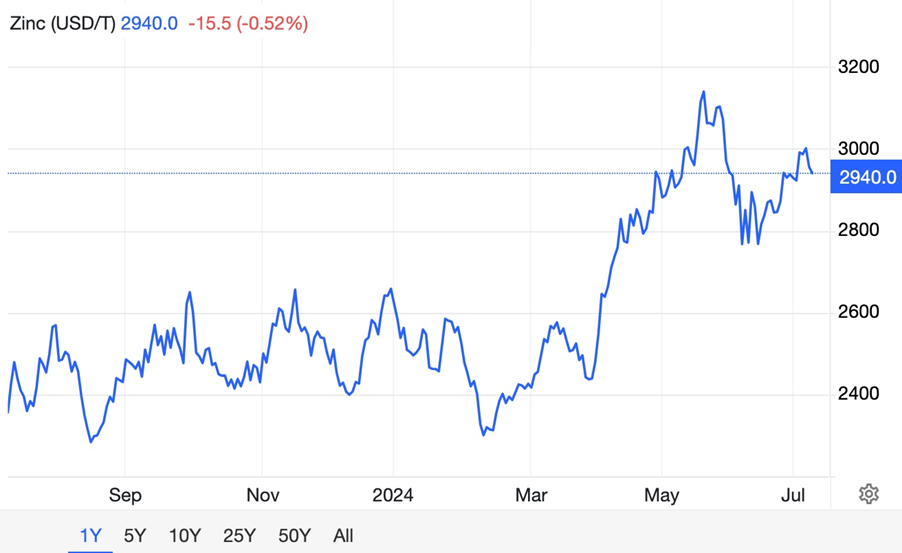
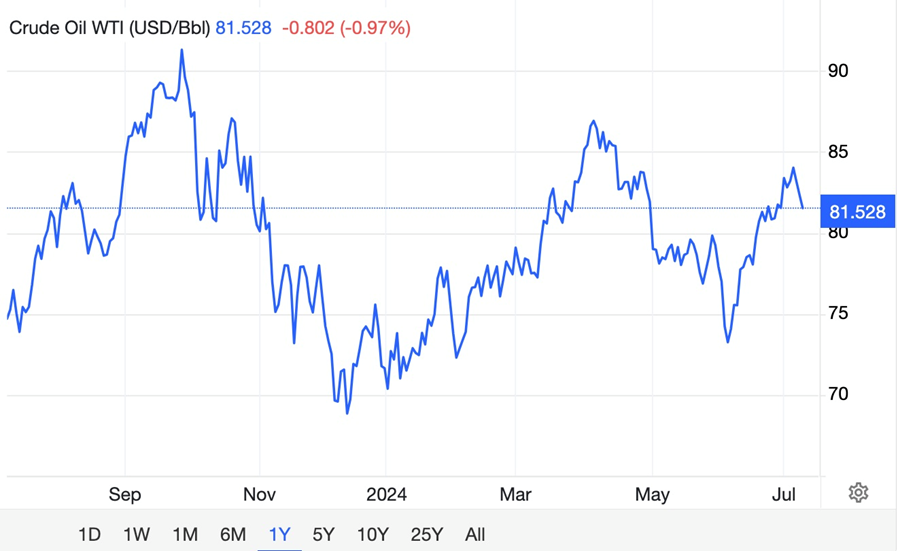
Some say that commodities are hedges against inflation and that people buy them when inflation is high. While there is some truth to that, it doesn’t explain why the dollar is surging at the same time as several commodities including gold, silver, copper, zinc, aluminum, molybdenum and crude oil are all rising in price. As for inflation? It’s actually been falling, as the chart above proves.

I believe the more likely reason has to do with interest rates. We have proven in several articles that interest rates control strength or weakness in the dollar.
Generally, the dollar and US bond yields rise and fall together, signaling a positive correlation between the two. Conversely, the price of a bond and its yield are negatively correlated. The lower the price, the higher its yield. A rising yield favors dollar bulls. Falling bond yields make for a softer dollar. These are commonly accepted economic principles.
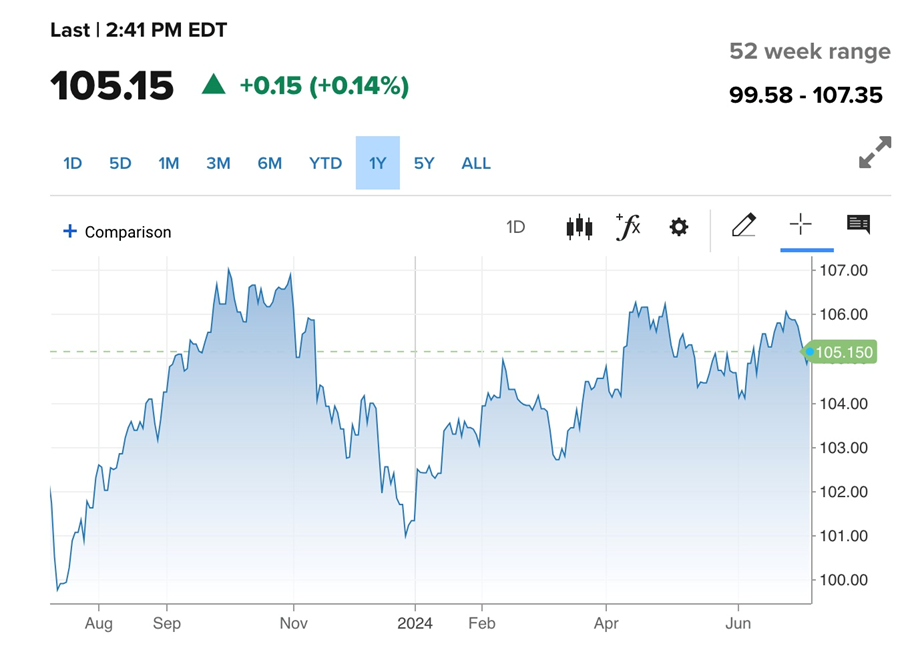
Demand for dollars has been strong, reflected in a US dollar index (DXY) over 105. DXY started 2024 at 102.49, and it is now at 105.15, a gain of 2.5%. This is partly due to the dollar functioning as a safe haven during war — the conflicts in Gaza and the Ukraine have raged all year and show no sign of ending — along with interest rates at their highest levels in 22 years, @ 5.25 to 5.50%.
Consider: if inflation starts heading back up, and the Fed goes back to hiking interest rates, a higher dollar will sink commodity prices. In other words, the dollar is a stronger variable than inflation when it comes to predicting whether commodities rise or fall.
Investors should, however, buy commodities as protection against a falling currency. When the dollar is weak we buy “real” things like metals, oil, land, etc. If you know the dollar’s going to weaken the best place to park your money is in monetary metals like gold and silver. Other commodities also do well in a low-dollar environment because more units of a commodity can be bought with dollars, and those with non-dollar currencies can buy more dollars with their home currencies. They use these dollars to buy commodities priced in US dollars.
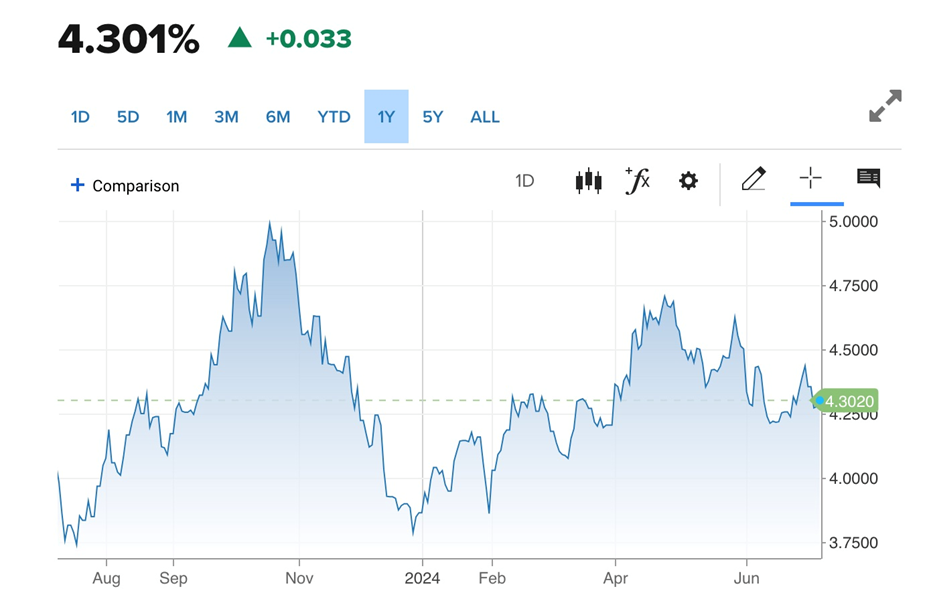
Bond investors are attracted to US Treasuries not only because they are a safe haven but because they pay a relatively high yield right now — 4.30% for the 10-year, 4.62% for the 2-year and 4.49% for the 30-year.
The purchase of more commodities in a low-dollar environment exacerbates shortages in markets showing low supplies. All three metals being discussed here — gold, silver and copper — are either undersupplied now or will be in the near future.
The dollar hasn’t dropped yet. But those in the know (including us at AOTH) believe it will. A Goldman Sachs note to clients Monday said hedge funds bought commodity-sensitive stocks in the week to July 5 at the fastest pace in five months. (BOE Report, July 8, 2024)
If commodity prices are doing well now, while the dollar is high, how much higher could they go when interest rates and the dollar fall?
Gold
The specter of lower interest rates is a bullish signal for gold. FX Street commented on Monday that gold continues to gain support from geopolitical and macro factors, such as ongoing conflicts in the Middle East and Ukraine.
Egon von Greyerz, chairman of Gold Switzerland, points out that the political instability inherent in current and future elections this year is another good reason for owning precious metals. Especially given that out-of-control government spending is likely to be the predominant policy response. Examples are the new Labour government in Britain, France’s new coalition government, and “an insoluble debt crisis” in the US no matter which presidential candidate wins in November.
Meanwhile, de-dollarization by countries at odds with the United States, who fear that the US could freeze their dollar assets like Washington did to Russia following the invasion of Ukraine, is increasing the appeal of gold as a foreign-exchange alternative.
BRICS nations, now wealthier than the G7 and accounting for one-third of the world’s GDP, are reportedly discussing the launch of a BRICS cryptocurrency potentially backed by gold.
A recent report from the World Gold Council sees climate change as another source of safe-haven gold demand:
Gold’s carbon profile and decarbonisation potential may reinforce or amplify gold’s role as a safe haven asset, risk hedge and store of value during periods of market stress.
“This lends further credence to our analysis suggesting that gold’s long-term returns may be more robust than those of many mainstream asset classes in the context of a range of climate scenarios.”
Although a recent analysis finds gold only becomes an inflation hedge over long periods of time; 10 years is too short.
In a paper, Prof. Campbell Harvey of Duke University and co-author Claude Erb write that, for investors who add gold in their portfolio today, with high inflation and gold prices close to an all-time high, the expectation that gold will keep its real value in the next 10 years is not consistent with history.
“When gold is at an all-time high, the expected returns over the next 10 years — according to historical experience — is very low,” Harvey said.
As evidence of gold acting as a longer-term hedge, Campbell and Harvey offer the example of a Roman centurion who was paid 38.58 ounces of gold two millennia ago.
“At today’s price of gold, it would be $86,300, which is very close to the salary of a U.S. Army captain with six years of experience — $85,600,” Harvey said.
High central bank demand, which accounts for about a quarter of the gold market, is an additional factor in favor of gold.
In its annual survey, the World Gold Council said more central banks plan to add to their gold reserves within a year, despite high prices. Gold hit a record-high $2,449.89 per ounce on May 20. The survey said 29% of central banks expect their gold reserves to increase in the next 12 months, the highest level since the WGC began the survey in 2018, and compared with 24% in 2023.
Livemint says relentless demand from retail buyers in China and India, — the two largest physical gold consumers — along with fund investors, futures traders and central banks, drove gold to unprecedented heights.
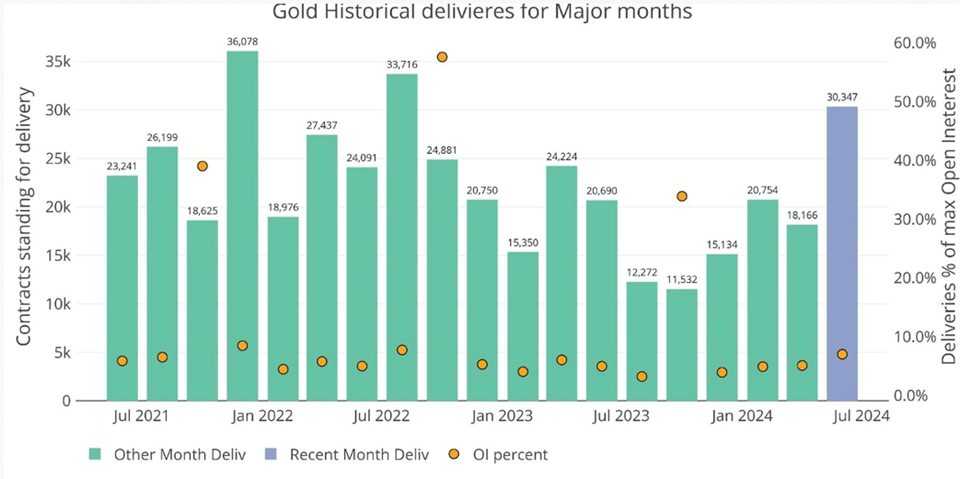
Meanwhile the CME Comex, an exchange where futures are traded for gold, silver, and other commodities, has been seeing big moves in silver and gold. This means more people are taking delivery of physical metal.
According to Schiff Gold, May showed open interest in gold at well above trend — 30,000 contracts stood for delivery in June, the largest volume since August 2022.
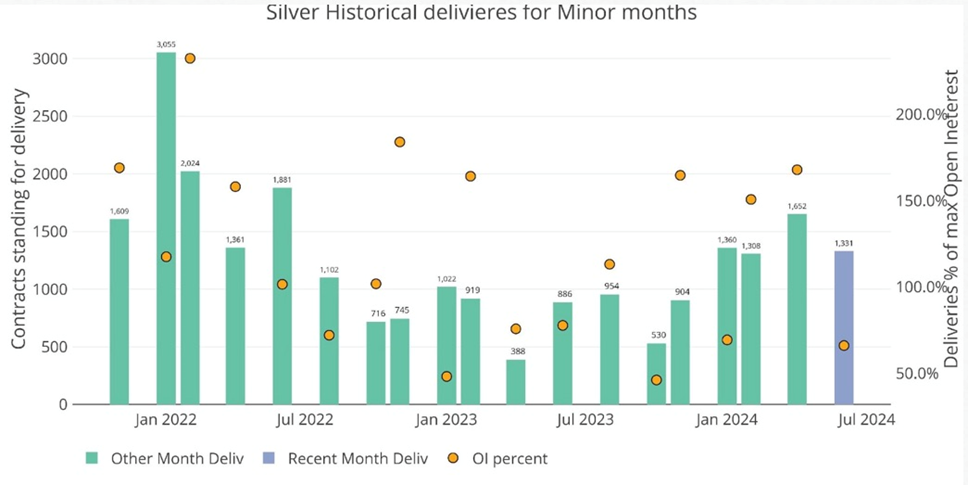
Activity in silver has also picked up after a quiet 2023.
As for gold exchange-traded funds, a major source of gold investment demand, outflows have flipped to inflows. Globally, gold ETFs saw the second consecutive month of inflows in June due to additions to holdings by Europe- and Asia-listed funds, the World Gold Council (WGC) said on Tuesday, via Reuters. (although collective holdings remain at their lowest since 2020)
Finally, gold prices are pushing higher due to a shortfall of mined gold.
In a world of resource depletion, it falls to gold exploration companies to fill the gap with new deposits that can deliver the kind of production required to meet gold demand, which is currently out-running supply.
The gold market continues to experience tightness due to difficulties expanding existing deposits, and a pronounced lack of large discoveries in recent years.
In 2023, 4,448 tonnes of gold demand minus 3,644t of gold mine production left a deficit of 804t. Only by recycling 1,237t of gold jewelry could the demand be met. (The World Gold Council: ‘Gold Demand Trends Full Year 2023’)
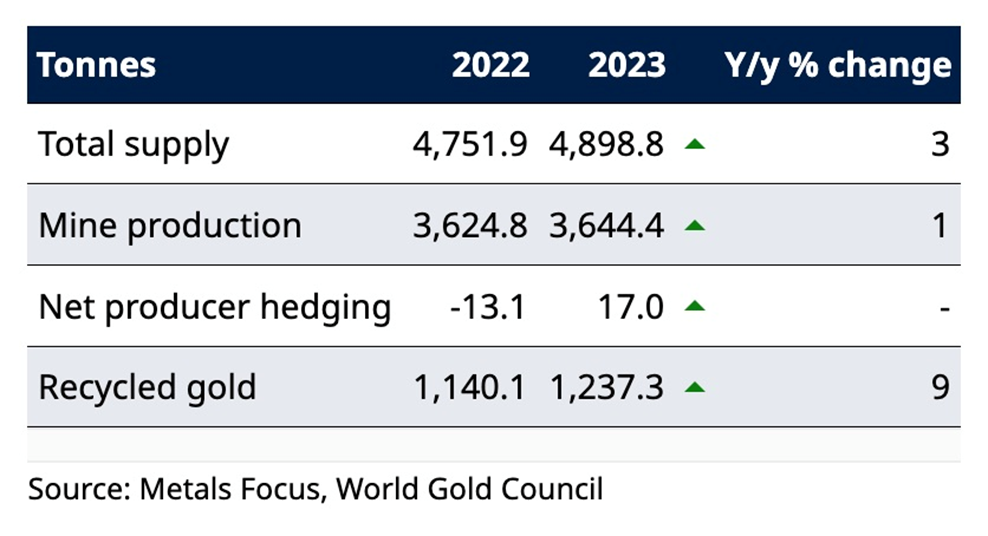
This is our definition of peak gold. Will the gold mining industry be able to produce, or discover, enough gold, so that it’s able to meet demand without having to recycle jewelry? If the numbers reflect that, peak gold would be debunked. We’ve been tracking it since 2019, and it hasn’t happened yet.
Silver
Like gold, we can study the supply-demand picture for silver to get a sense of whether we’ve reached peak mine supply.
At AOTH we differentiate between the total silver supply, which lumps in recycled silver with mined silver, versus mine supply on its own.
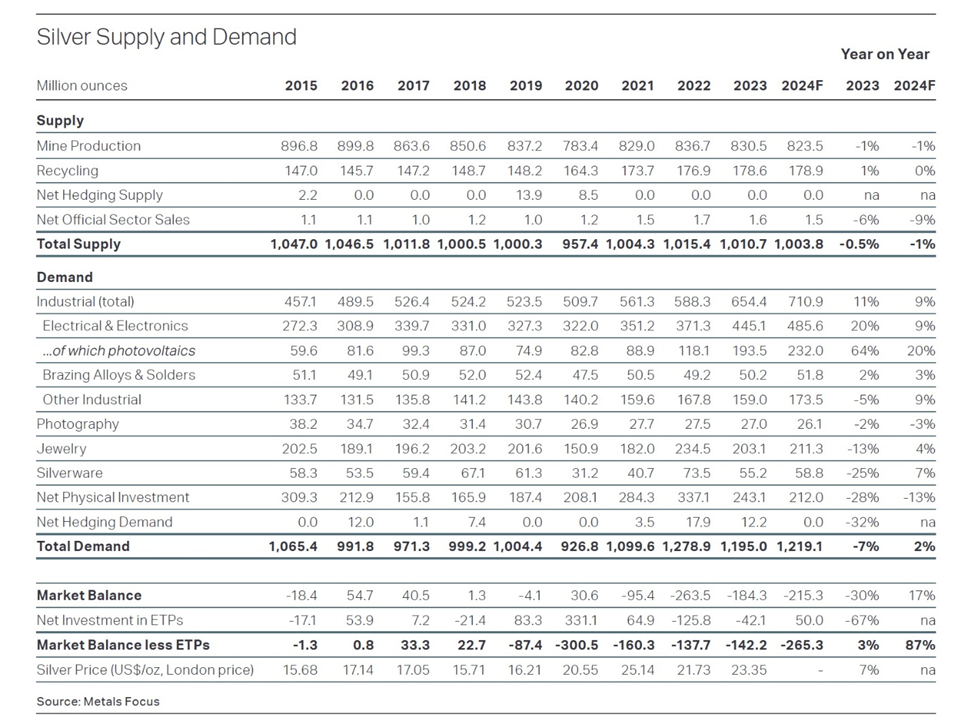
According to the 2024 Silver Survey, in 2023 global mine production fell 1% to 830.5 million ounces, or 25,830 tonnes. Weaker output in Mexico owing to a strike at Newmont’s Penasquito mine and lower ore grades in Argentina were key drivers of the fall.
Silver recycling inched up by 1% to a 10-year high of 178.6Moz. Combined, therefore, we have total silver supply reaching 1.010 billion ounces in 2023.
How about demand? According to the survey, following a record 2022, world silver demand in 2023 fell 7% to 1.195Moz. It was still 9% higher than the next highest yearly total. Offtake from the industrial sector achieved a record high last year, rising 11% to 654.4Moz, mainly due to gains in the solar sector.
(Remember: While most of the mined gold is still around, either cast as jewelry, or smelted into bullion and stored for investment purposes, the same cannot be said for silver. It’s estimated around 60% of silver is utilized in industrial applications, like solar panels and electronics, leaving only 40% for investing. Of the 60% used for industrial applications, almost 80% ends up in landfills.)
2023 demand of 1.195 billion ounces outstripped supply of 1.010Boz, by 185Moz. But remember, recycling is included in the total supply. When we take recycling out, 178Moz, we get an even greater deficit of 364.5Moz. (1,195,000,000 minus 830,500,000 = 364,500,000)
This is significant, because it’s saying that mined silver supply last year was unable to meet total demand, industrial plus investment, of 1.195 billion ounces. It fell short by 185Moz, and that was including recycling.
This is our definition of peak mined silver. Will the silver mining industry be able to produce, or discover, enough silver that it’s able to meet demand without having to recycle? If the numbers reflect that, peak mined silver would be debunked.
At AOTH, we know that silver prices track gold prices, and that there is approximately the same amount of investable grade silver above-ground as gold. Yet silver is currently 1/76th the price of gold. This means that when silver is highly demanded, like now — it is both a monetary and an industrial metal — the price often slingshots past gold.
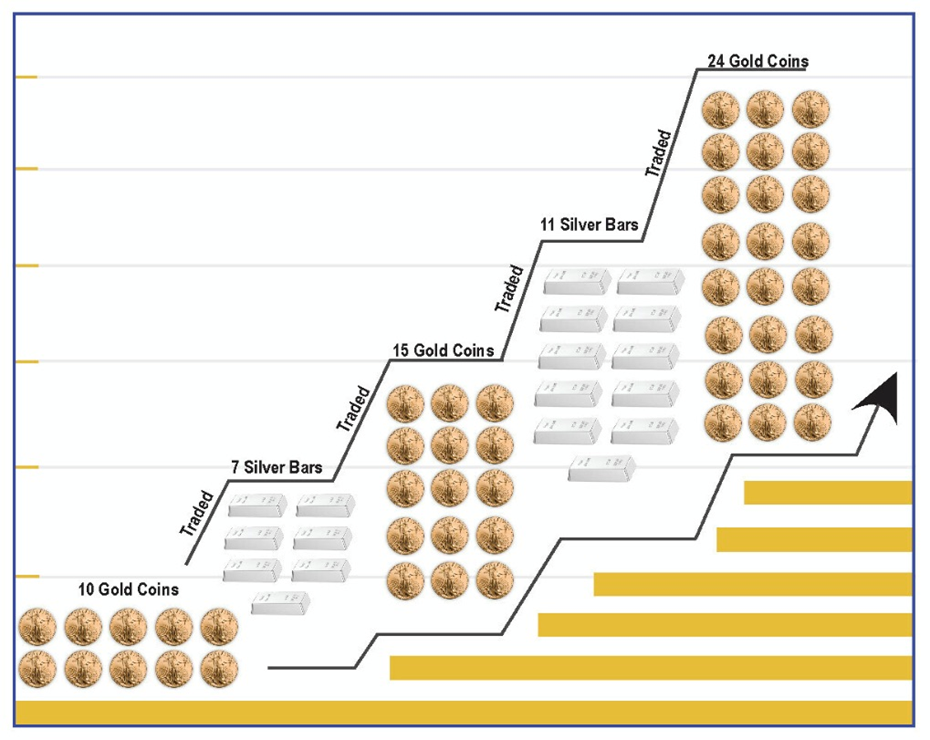
Source: McAlvany
So far this year, silver has outperformed gold, gaining 33% against gold’s 15% rise. The same thing happened in 2020, when the pandemic precipitated the “fear trade” in precious metals.
Gold is moving higher primarily due to central bank buying, and physical gold purchases in Asia.
Who’s buying all the silver? India and silver-backed ETFs.
The Silver Institute reported a 184.3 million-ounce deficit in 2023 on the back of robust industrial demand.
In an April commentary, SI said industrial demand rose 11% last year to a new record of 654.4Moz, smashing the old record set in 2022.
In fact demand exceeded supply for the third year in a row.
Higher-than-expected photovoltaic (PV) capacity additions and faster adoption of new-generation solar cells raised electrical & electronics demand by a substantial 20%, to 445.1Moz, the institute said.
The Silver Institute expects demand to grow by 2% this year, led by an anticipated 20% gain in the PV market. Industrial fabrication should post another all-time high, rising by 9%. Demand for jewelry and silverware fabrication are predicted to rise by 4% and 7%, respectively.
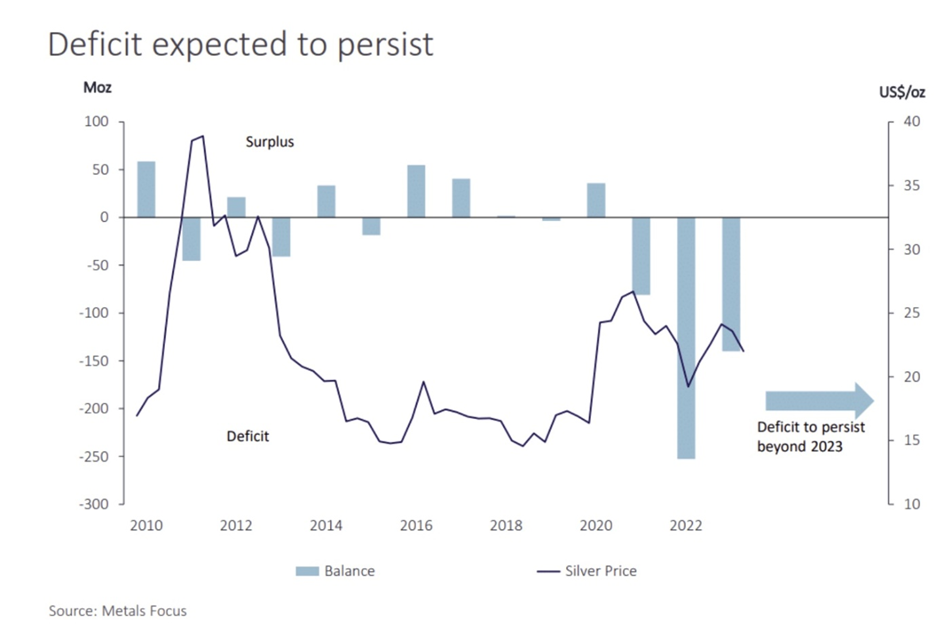
Total silver supply should decrease by another 1%, meaning 2024 should see another deficit, amounting to 215.3Moz, the second-largest in more than 20 years.
Deficits should persist beyond 2024, the Silver Institute said, citing Metals Focus. According to Metals Focus, this is due to significant and expanding industrial demand for silver.
Copper
Copper may have come off the boil recently due to problems in China but the structural supply deficit is real and keeping prices elevated.
Benchmark Mineral Intelligence (BMI) forecasts global copper consumption to grow 3.5% to 28 million tonnes in 2024, and for demand to increase from 27 million tonnes in 2023 to 38 million tonnes in 2032, averaging 3.9% yearly growth.
Yet the US Geological Survey reports supply from copper mines in 2023 amounted to only 22 million tonnes. If the copper supply doesn’t grow this year, we are looking at a 6Mt deficit.
Mining companies are seeing their reserves dwindle as they run out of ore. Commodities investment firm Goehring & Rozencwajg says the industry is “approaching the lower limits of cut-off grades and brownfield expansions are no longer a viable solution. If this is correct, then we are rapidly approaching the point where reserves cannot be grown at all.”
Without new capital investments, Commodities Research Unit (CRU) predicts global copper mine production will drop to below 12Mt by 2034, leading to a supply shortfall of more than 15Mt. Over 200 copper mines are expected to run out of ore before 2035, with not enough new mines in the pipeline to take their place.

Last year, the government of Panama ordered First Quantum Minerals (TSX:FM) to shut down its Cobre Panama operation, removing nearly 350,000 tonnes from global supply.
A strike at another large copper mine, Las Bambas in Peru, temporarily halted shipments.
Copper specialist Anglo American says it is scaling back output by about 200,000 tons, owing to head grade declines and logistical issues at its Los Bronces mine. Los Bronces production is expected to fall by nearly a third from average historical levels next year as the miner pauses a processing plant for maintenance, Reuters said.
Chile’s copper output has been dented by a long-running drought in the country’s arid north. State miner Codelco’s 2023 production was the lowest in 25 years.
All four of Codelco’s megaprojects have been delayed by years, faced cost overruns totaling billions, and suffered accidents and operational problems while failing to deliver the promised boost in production, according to the company’s own projections.
There are also concerns about Zambia, Africa’s second largest copper producer, where drought conditions have lowered dam levels, creating a power crisis that threatens the country’s planned copper expansion.
Ivanhoe Mines (TSX:IVN) reported a 6.5% Q1 drop in production at the world’s newest major copper mine, Kamoa-Kakula in the DRC.
The tightness of the copper concentrate market has been reflected in treatment and refining charges plummeting from over $90 per tonne to below $10/t.
(Miners pay smelters a fee to process copper concentrate into refined metal, to offset the cost of the ore. TC/RCs fall when tight concentrate supplies squeeze smelters’ profit margins.)
This drastic reduction compelled Chinese smelters, responsible for around half of global refined copper production, to consider a 5-10% production cut.
That was in March. By July, the situation had flipped 180 degrees. Now China is apparently swimming in copper, so much so that it is exporting refined copper to London Metal Exchange warehouses, which are full to the brim. LME warehouse stocks are reportedly above 190,000 tonnes for the first time since last October.
The Financial Times wrote on June 18 that The biggest glut of copper in four years has built up in Chinese warehouses, after a price jump and tepid consumer demand prompted manufacturers in Asia’s largest economy to pull back on buying the world’s most important industrial metal. Stocks of the metal in Shanghai Futures Exchange warehouses have grown to their highest level since 2020 at about 330,000 tonnes this month, according to Bloomberg data. Before then, the last time they hit this level was in 2015.
The rise in copper inventories reflects China’s real estate downturn as well as sluggish manufacturing and credit activity, as Beijing shies away from directly stimulating household consumption. In the four weeks since the record high, copper has fallen 13 per cent to $9,600 per tonne, weighed down by weak Chinese demand.
Yet as warehouse stocks build up in China and the UK, the country is importing large amounts of red metal. Reuters metals columnist Andy Home wrote on July 10 that China imported 1.61 million tons of refined copper in the first five months of the year, a year-on-year increase of 19.2%.
The comparison is somewhat flattered by a low base in early 2023, when imports were relatively weak. But imports over the last 12 months have been a robust 3.98 million tons, a level exceeded only once on an annual basis in 2020.
Exports jumped to 73,860 tons in May, the highest monthly volume since May 2016, as smelters exported into a profitable arbitrage window with the London market…
The core driver of rising imports has been the Democratic Republic of Congo, which last year overtook Chile as China’s top supplier of refined copper.
Imports from the Congo grew from 480,000 tons in 2020 to 870,000 in 2023. Volumes so far this year have jumped by another 78% to 548,000 tons.
China is the world’s largest copper consumer so China’s actions in the market are watched closely because they affect the price.
To ensure self-sufficiency, China has expanded its network of copper smelters, meaning it will import much more copper ore for processing domestically.
“Like all countries, China sees a strategic need for copper — particularly now with the growth in green energy applications — and China like other countries wants to ensure self sufficiency,” said Craig Lang, principal analyst at researcher CRU Group.
“China will account for about 45% of global refined copper output this year, according to CRU,” Bloomberg wrote in 2023.
Let’s summarize what’s going on here. China is expanding its smelter capacity. To do this, it requires more ore and it is getting it mostly from the DRC, which has overtaken Peru as the second-largest copper-producing country. Imports are surging at the same time as warehouses are filling up.
China has tricked the market before into believing there is a surplus when in fact there is a deficit. I exposed this “Copper Con” in March 2015. Here’s what happened:
China found every analyst they could and invited them to China. The group was shown a few warehouses stacked with copper to the rooftops. There was so much copper the ground was compacting, said one analyst. Another said the stacks were falling over like dominos. The world bought the surplus story, swallowed it hook line and sinker. Headlines screamed ‘China has enough copper!’
Of course it wasn’t true. China needed copper, and what they had, all of 2 million tonnes, was tied up in financing deals. At any one time there are at least 1 million tonnes in transport, or somewhere in the supply chain that has already spoken for, i.e.., not available.
The world continues to get conned. Every year so-called “experts” predict a surplus; instead what happens? Deficit after supply deficit.
It makes sense that China would try to manipulate the market not long after copper hit a record high. China wants to pay lower prices for its copper and has created an artificial surplus by filling up its Shanghai warehouses and exporting refined copper to LME warehouses. The tactic worked. Spot copper is down 14.7% since its May 20 pinnacle.
On the demand side, along with the usual applications in construction wiring and plumbing, transportation, power transmission and communications, there is now added demand for copper in electric vehicles and renewable energy systems.
Millions of feet of copper wiring will be required for strengthening the world’s power grids, and hundreds of thousands of tonnes more are needed to build wind and solar farms. Electric vehicles use triple the amount of copper as gasoline-powered cars. There is more than 180 kg of copper in the average home.
Additional copper is being demanded by the electrification of public transportation systems, 5G and AI.
According to Nikkei Asia, prices are being buoyed by the need for more data centers to support the development of artificial intelligence, all of which will require copper.
The latest copper demand driver comes from the Ukraine, where the war with Russia is consuming tonnes of bullet cartridge casing made of brass, an alloy of copper and zinc.
The European Defense Agency says a NATO 155-mm artillery shell contains half a kilogram of copper, with Ukrainian forces firing up to 7,000 per day.
Citigroup is bullish on copper going forward, with the bank’s analysts predicting that prices could surpass $10,000 a tonne ($4.53/lb) this year due to policy support in China. (the incentive price to build new mines is $11,000/t)
Mining.com reports Beijing is expected to introduce further stimulus to upgrade its renewable energy infrastructure at the Third Plenum meeting in mid-July:
These additional measures, specifically targeting domestic property and grid investments, are expected to support copper prices in the near term, Citi analysts said in a note.
(By Richard Mills)
Legal Notice/Disclaimer
Ahead of the Herd newsletter, aheadoftheherd.com, hereafter known as AOTH.
Please read the entire Disclaimer carefully before you use this website or read the newsletter. If you do not agree to all the AOTH/Richard Mills Disclaimer, do not access/read this website/newsletter/article, or any of its pages. By reading/using this AOTH/Richard Mills website/newsletter/article, and whether you actually read this Disclaimer, you are deemed to have accepted it.
Any AOTH/Richard Mills document is not, and should not be, construed as an offer to sell or the solicitation of an offer to purchase or subscribe for any investment.
AOTH/Richard Mills has based this document on information obtained from sources he believes to be reliable, but which has not been independently verified.
AOTH/Richard Mills makes no guarantee, representation or warranty and accepts no responsibility or liability as to its accuracy or completeness.
Expressions of opinion are those of AOTH/Richard Mills only and are subject to change without notice.
AOTH/Richard Mills assumes no warranty, liability or guarantee for the current relevance, correctness or completeness of any information provided within this Report and will not be held liable for the consequence of reliance upon any opinion or statement contained herein or any omission.
Furthermore, AOTH/Richard Mills assumes no liability for any direct or indirect loss or damage for lost profit, which you may incur as a result of the use and existence of the information provided within this AOTH/Richard Mills Report.
You agree that by reading AOTH/Richard Mills articles, you are acting at your OWN RISK. In no event should AOTH/Richard Mills liable for any direct or indirect trading losses caused by any information contained in AOTH/Richard Mills articles. Information in AOTH/Richard Mills articles is not an offer to sell or a solicitation of an offer to buy any security. AOTH/Richard Mills is not suggesting the transacting of any financial instruments.
Our publications are not a recommendation to buy or sell a security – no information posted on this site is to be considered investment advice or a recommendation to do anything involving finance or money aside from performing your own due diligence and consulting with your personal registered broker/financial advisor.
AOTH/Richard Mills recommends that before investing in any securities, you consult with a professional financial planner or advisor, and that you should conduct a complete and independent investigation before investing in any security after prudent consideration of all pertinent risks. Ahead of the Herd is not a registered broker, dealer, analyst, or advisor. We hold no investment licenses and may not sell, offer to sell, or offer to buy any security.
{{ commodity.name }}
{{ post.title }}
{{ post.date }}


Comments