Gold price breaks 3-year losing streak
Gold ended the last trading day of 2016 on a sour note, but the precious metal should at least enter the new year having broken the downtrend in place since the election of Donald Trump.
In late afternoon trade on the Comex division of the New York Mercantile Exchange gold for February delivery was changing hands for $1,152.90 an ounce, down $5.20 from Thursday’s close.
Gold ends 2016 with a gain of 8.6% after touching six-year lows at the end of 2015. But bears had the better of it in the second half of the year – the metal declined by more than 16% after hitting an intra-day high of $1,377 on July 6.
While the Dow Jones never quite breached the 20,000 mark, the blue-chip index enjoyed its biggest annual gain since 2013
It’s the first annual gain since 2012. For the year the average gold price came in at $1,247 an ounce, compared to 2015’s average of $1,160, but nowhere near 2012’s $1,689.
Gold came under huge pressure after the US elections on November 8 as investor money rotated out of gold and into stocks.
While the Dow Jones Industrial never quite breached the 20,000 mark, the blue-chip index enjoyed its biggest annual gain in three years, adding 13.4%. The broader S&P 500 index also beat gold (but not by much) with a 9.5% return for the year.
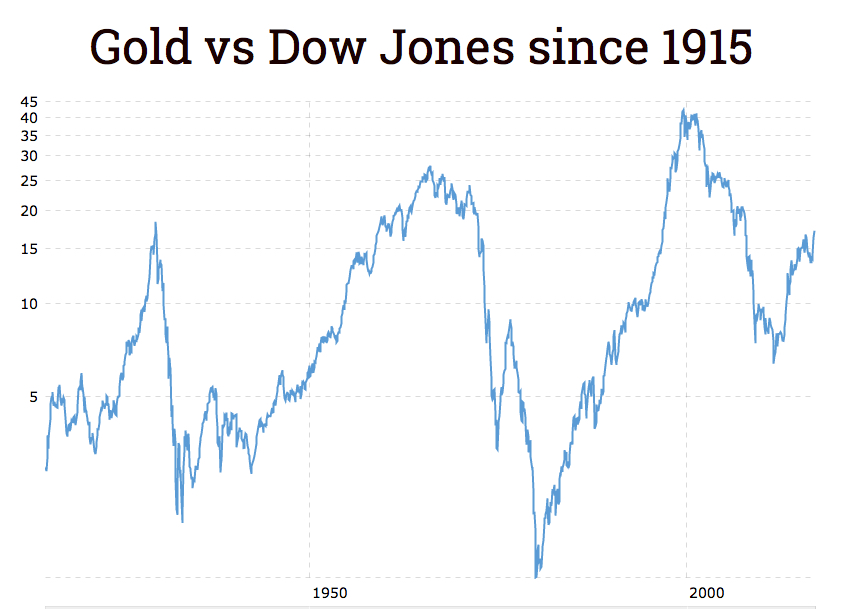
This 100-year chart of the Dow Jones index from Macrotrends tracks how many ounces of gold it would take to buy the Dow over any given month.
Previous cycle lows have been 1.9 ounces in February of 1933 and 1.3 ounces in January of 1980 when gold in inflation-adjusted terms hit an all-time high of roughly $2,400 an ounce.
When the nominal price of gold hit a record high above $1,900 in August 2011 the ratio was 6.4. That compares to highs around 40 between mid-1999 when gold reached lows of $250 an ounce and mid-2001.
On Friday the Dow-Gold ratio was at 17.1 meaning gold is now cheapest compared to equities since October 2007.

{{ commodity.name }}
{{ post.title }}
{{ post.date }}


Comments