Gold exploration trends: drilling up, Canada leads – September 2019
The following is the analysis of monthly gold exploration trends from January to September 2019 using data from the Mining Intelligence Data Application. The data used represents reporting companies listed on the following stock exchanges: TSX (+TSX-V), ASX, LSE (+LSE-AIM), NYSE, and JSE.
Mining Intelligence data indicates that after a bleak month of August, exploration activity in the gold sector jumped in September and hit the second highest bar since the beginning of 2019, and both the number of drilled projects and the number of drillholes reported in September, were up in all major regions.
A trend towards exploration of advanced projects, rather than greenfield opportunities, was reversed in September with companies willing to take more early-stage exploration risks.
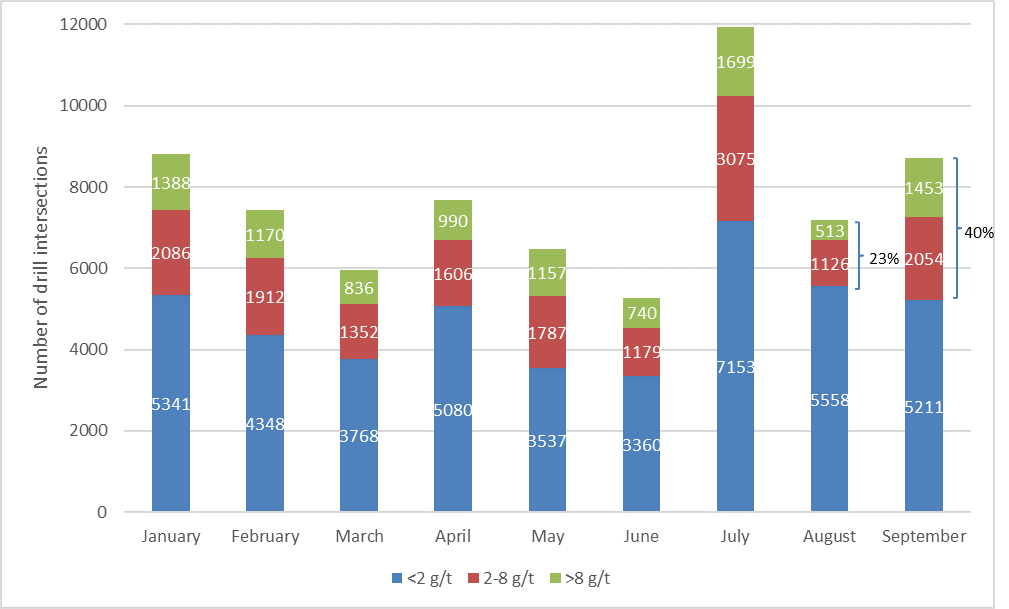
There was a noticeable improvement in overall drill intersection grades, with reported gold intersections with grades greater than 2 g/t have risen from 23% of their total count in August to 40% in September 2019.
Seven out of top ten highest-grade gold intersects reported in September 2019, were located in Canada.
Analysis
In September 2019, companies reported exploration results for 169 projects (Figure 1), which is the second highest count observed since the beginning of 2019. Canada overtook Australia and was the leading country in terms of a number of reported drilled projects (58), followed by Australia (50) and South America (21). Number of reported drilled projects was up in all major regions except Africa where it fell by 14%.
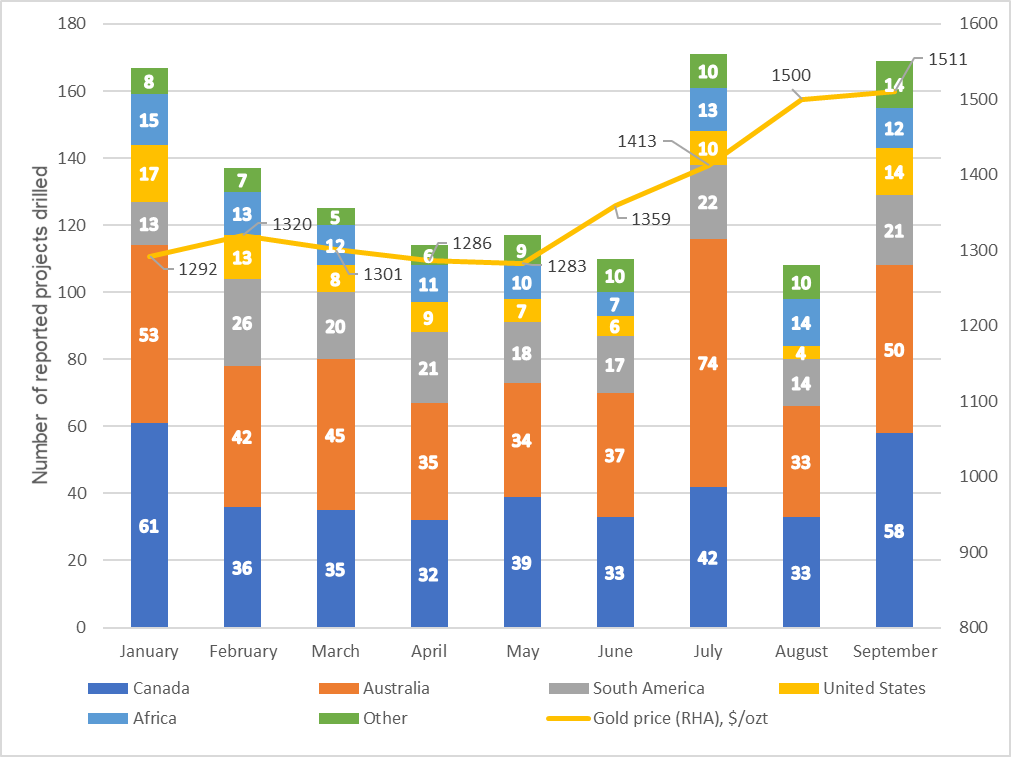
Figure 1. Number of reported drilled gold projects by region, January-September 2019. Source: Mining Intelligence
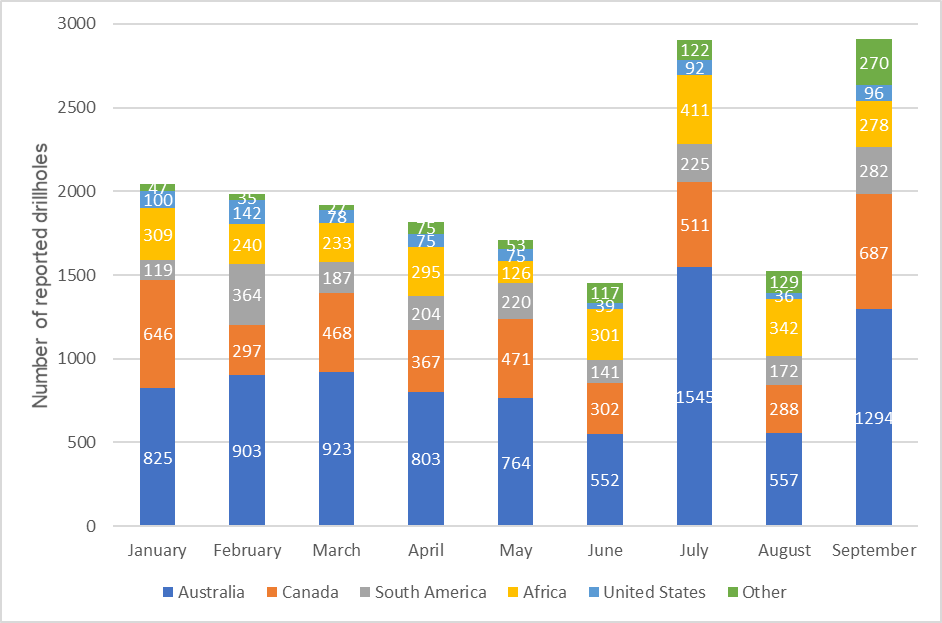
In September, companies reported results from 2,907 drillholes, which is almost twice more than in August (1,524 drillholes), and the highest number so far in 2019 (Figure 2). Amount of reported drillholes was up in all major regions except Africa and surged by a staggering 139% in Canada and by 132% in Australia.
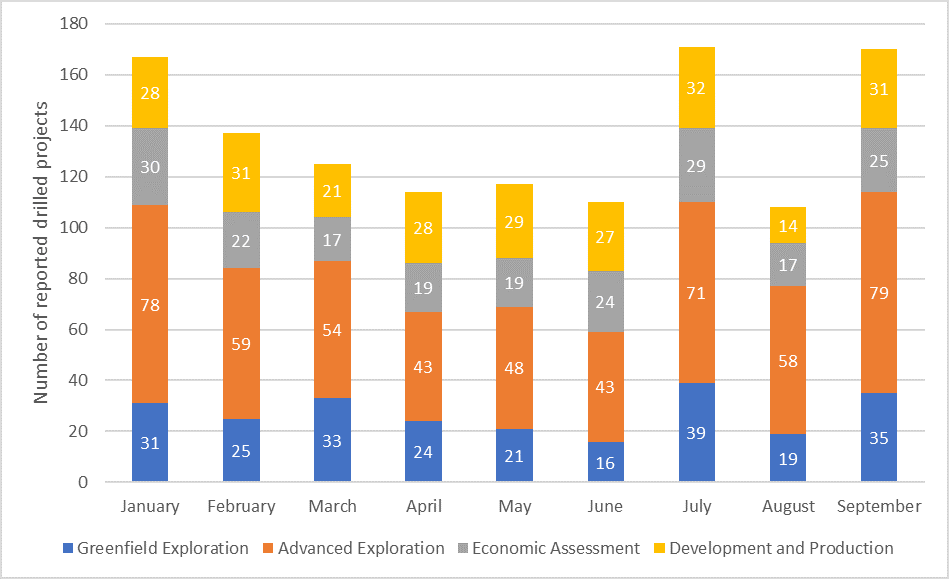
Weight of early and advanced exploration projects in their total count decreased from 71% in August to 67% in September (Figure 3).
The number of greenfield exploration projects drilled reported in September was 35, which is 84% more than in August, and the second highest number since the beginning of 2019.
While still being prudent when allocating budgets to exploration campaigns, companies were willing to take more early-stage exploration risks.
As for the drill intersections grades, there was an increase in grades greater than 2 g/t that have risen from 23% (1,639 out of 7,197 intersections) in August to 40% of their total count (3,507 out of 8,718) in September 2019 (Figure 4).
Seven overall and first six highest-grade gold intersects reported in September 2019, belong to projects located in Canada, which is a remarkable fact saying a lot about quality of gold deposits local explorers and miners are currently focusing on.
Top ten gold intersections – September 2019, in gram-meter
| Rank | Project | Country | Owner | Status | Width, m | Grade, g/t | Grade x Width, gram-meter |
| 1 | Lamaque | Canada | Eldorado Gold | Production | 85.8 | 21.8 | 1,870 |
| 2 | Island | Canada | Alamos Gold | Production | 17.3 | 63.9 | 1,105 |
| 3 | Windfall Lake | Canada | Osisko Mining | PEA | 12.7 | 72.3 | 918 |
| 4 | Scadding | Canada | MacDonald Mines | Advanced Exploration | 4 | 210.2 | 841 |
| 5 | Canadian Malartic | Canada | Yamana / Agnico Eagle | Production | 149 | 5.5 | 820 |
| 6 | Saddle North | Canada | GT Gold | Advanced Exploration | 1,206 | 0.6 | 724 |
| 7 | Haile | United States | Oceanagold | Production | 2.5 | 286.1 | 715 |
| 8 | Treaty Creek | Canada | Tudor Gold | Advanced Exploration | 1,081.5 | 0.6 | 649 |
| 9 | Fortnum / Grosvenor | Australia | Westgold Resources | Production | 75 | 8.1 | 608 |
| 10 | Los Filos | Mexico | Leagold Mining | Production | 31.7 | 16.9 | 534 |
Grade width is calculated at width at the drill interception (in metres) multiplied by the grade (in grams of gold per tonne). Where multiple high-grade intersections were reported for an individual project, only the best interval has been considered.

{{ commodity.name }}
{{ post.title }}
{{ post.date }}


Comments