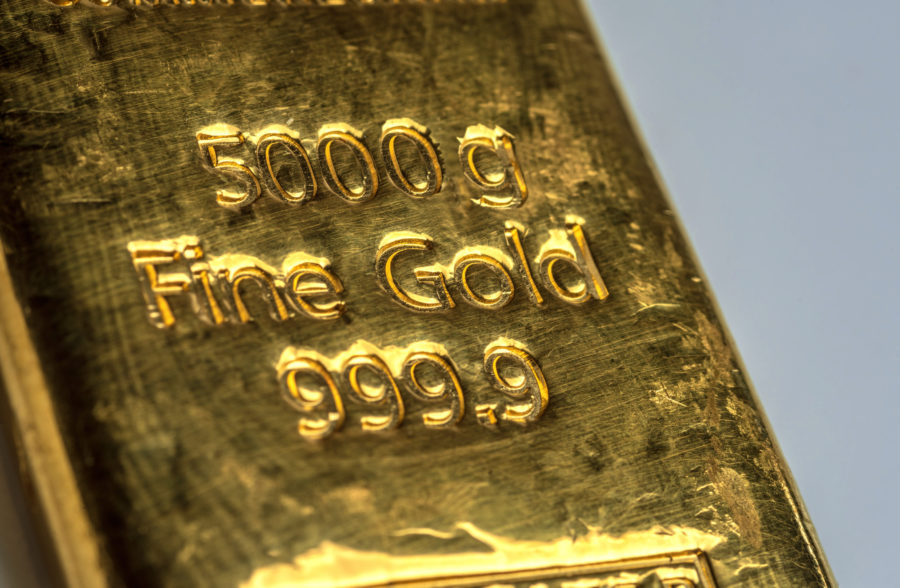
Gold Bullion Likely To Pullback Then Rocket Higher

Back in latter June I forecasted a big top in Gold, mostly due to the 5 wave structures up from the October 2008 lows to June highs, and the 5 waves up from February lows to June highs converging.  We then dropped from 1243 at the time of the forecast to $1155, which was one of my potential “A wave down” rally pivots.  I expected a counter-trend rally or “B” wave up to 1212-1225.  So, all of that worked out pretty well, until we hit $1238.  Now, $1238 is a 78% Fibonacci re-tracement of the drop from $1265 to $1155.  Normally, a re-tracement in a weaker market or sector is capped at 61.8% or 50%.

The strength of that counter-trend move caused me to go back and review my patterns a few more times.  Most of this is pure instinct and experience, but I think $1155 was the low of the correction.  It  also looks like that was an A B C correction to $1155, and with the strong rally… it means we are likely beginning a new set of 5 waves up from $1155.

That brings us to my recent commentary for my paying subscribers that I was going to review the wave patterns and that we closed our  Gold trading short position out several days ago with a small profit.  It is a a good thing we did because Gold rallied hard from 1212 to 1243 since that time, catching some people off guard.  At this time, Gold is quite overbought and due for a small corrective pattern. It would seem logical that after a rally from $1155 to $1243 roughly, that we would pull back 38-50% of that move, so I’m looking for a pullback to around $1200 plus , and then a rally.  We could see new highs in Gold in the next few months, and $1300 is on the radar now.

In summary, I got the topping call right, the bottom pivot right, and the counter-rally pretty much right…. but I’m changing my views to BULLISH intermediately after a pullback, from BEARISH intermediately. Obviously the fundamentals for Gold have never been stronger, but I was expecting a deeper correction off the 21 month rally, and instead to me it looks like with Quantitative Easing 2 upon us that Gold buyers are really stepping up their gold purchases.

Below is an updated Elliott Wave based chart showing clear corrective (3 wave) patterns from December 2009, and bullish (5 wave) pattern from February through the June 2010 highs.  We just completed a 3 wave correction to $1155, and now this is probably a short-term peak wave 1 up, with a mini-wave 2 down to $1200 or so to follow.  Once done with a pullback, we could see a run to $1280 or so, and later over $1,300.

david-banister1

If you’d like to receive free weekly reports, check us out at www.markettrendforecast.com

David Banister