Summary:
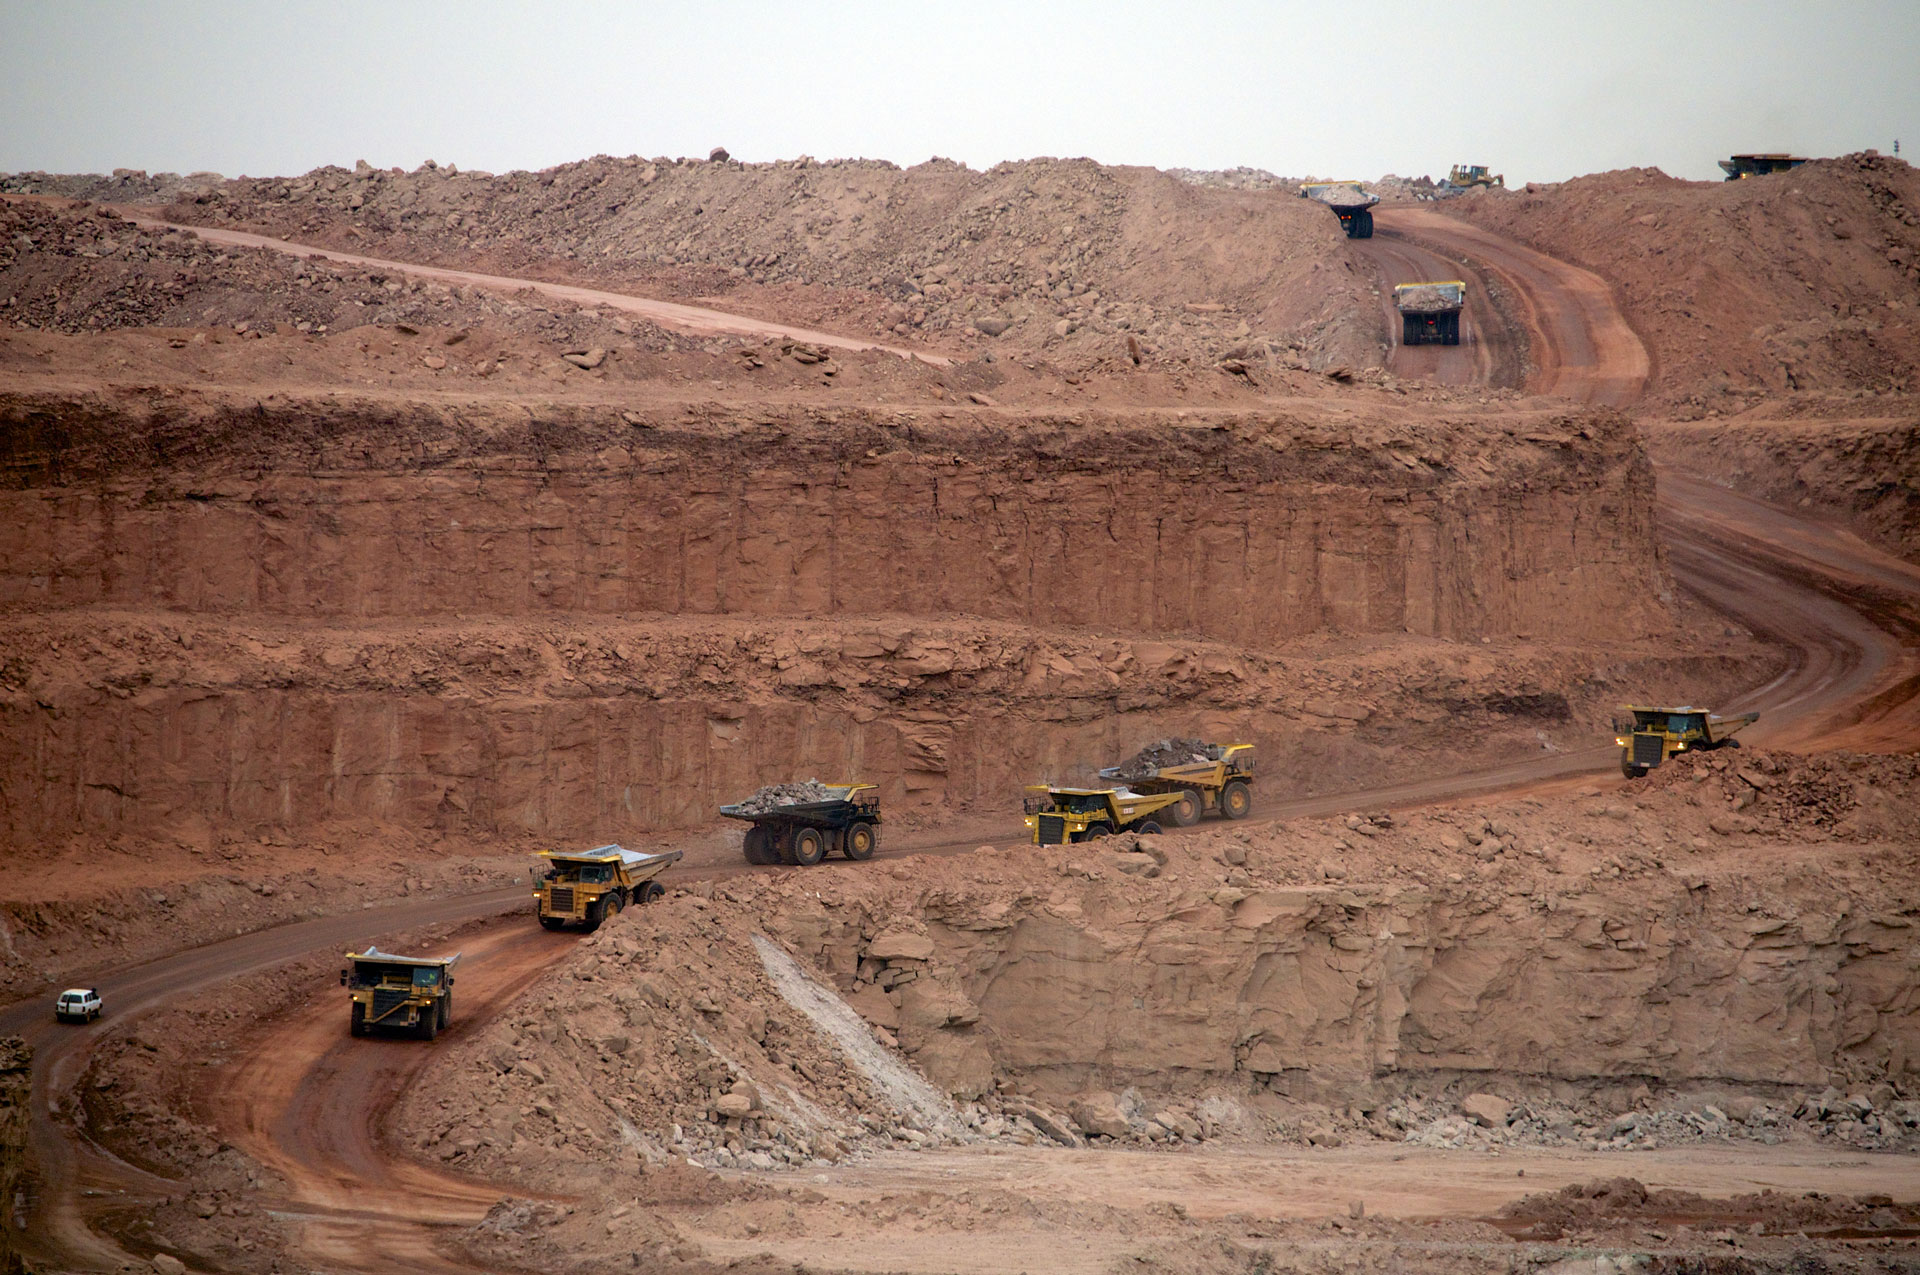
The global key 10 uranium mining companies saw a marginal increase in revenue and operating income, and a decline in average return on capital employed in the financial year ended 2009. The industry saw an increase in the financial leverage illustrated by an increase in the average debt/equity ratio during the same period. Increase in financial leverage has led to a decline in the return on capital employed. Cameco and Areva, the two key uranium companies together produced more than a quarter of the global uranium production in 2009. These companies account for about 28.5% of the world’s total uranium production, which stood at 14,437 tons of uranium (tU) while the global production was 50,572 tU in 2009. The higher production of these companies was aided by their operations in some of major producing mines in the world, including McArthur River, Arlit, Rabbit Lake and Smith Ranch-Highland. GlobalData estimates that more than 10 uranium mines are expected to produce uranium in 2010. This will result in a further increase in uranium production in 2010.
Peer Comparison of Key Uranium Mining Companies on Key Financial and Operational Parameters, 2005-2009
The article covers comparison of the key uranium mining and producing companies based on their key and operational parameters and their growth trajectory during the period 2005-2009. The companies included in the article are Uranium One Inc, Denison Mines Limited, Paladin Energy Ltd, BHP Billiton, Rio Tinto Plc, Energy Resources of Australia Ltd, Areva, AngloGold Ashanti Limited, Cameco Corporation and Uranium Resources, Inc.
The global financial crisis has had an impact on uranium production similar to other commodities, causing reduced production from a few mines. This is due to the closure of operation in a few mines on account of lower economic viability leading to reduced production. Lack of equipment, higher production costs, and low demand for uranium in the global nuclear power market are the reasons behind the reduction of production by some companies. Uncertainties in the production of uranium precipitated the termination of many long-term contracts finalized by the mining companies and nuclear power utilities.
The price of uranium has plummeted from an average of $62/lb in 2008 to $46/lb in 2009, due to reduced demand for uranium. The declining uranium prices, inflation related production cost increase, slower than expected increase in mine development and production forced a few of the uranium producing companies to place some of their operating mines under care and maintenance.
The figure below shows the annual uranium production percentage share by key uranium mining companies in 2009. Cameco Corporation contributed the highest percentage share, 28.70%, to the total uranium production in 2009, followed by Areva with 23% and Rio Tinto Plc with 19.51%. The annual production of the top four companies constituted about 80% of the total uranium production from the key uranium mining companies in 2009.
Key Findings
The total uranium production of the key 10 uranium mining companies increased at a Compound Annual Growth Rate (CAGR) of 1.78% from 26,005 tU in 2005 to 27,907 tU in 2009. This was attributed to reduced production from major mines such as Ranger and also due to the closure of a few mines by some companies. The average uranium production of the key 10 uranium companies increased from about 2,600 tU in 2005 to 2,791 tU in 2009. Amongst these companies, Cameco with a production of 8,009 tU was the major producer of uranium in 2009. Areva and Rio Tinto Plc occupy the second and third positions, respectively during the same year.
Uranium One Inc and Paladin Energy Ltd occupy the top two positions in terms of percentage increase in production with a CAGR of 27.39% and 10% respectively. BHP Billiton is ranked number one in terms of average uranium production per mine with 2,955 tU followed by Rio Tinto Plc with 2,722 tU and Cameco Corporation with 1,602 tU respectively in 2009.
BHP Billiton, Denison Mines Limited and Paladin Energy Ltd are the companies with maximum Reserve per Production (R/P) ratio in 2009. This clearly indicates the higher the number of operational years, the lower the risk involved for these companies.
Cameco Corporation was the Leading Uranium Mining Company Based On Total Uranium Production in 2009
Cameco enjoys the dominant position in the global uranium mining industry with a total production of about 8,009 tU from three geographical territories in 2009. Uranium One Inc had the highest production growth rate among these uranium mining companies. The company’s production increased at 27.3% during the period 2005-2009. The other largest uranium producing companies were Areva and Rio Tinto in 2009. The total uranium production of the key 10 mining companies increased at a rate of 1.78% from 26,005 tU in 2005 to 27,907 tU in 2009. BHP Billiton recorded a production of 2,955 tU from operations in only one mine making it the largest company in terms of average production per mine. The figure below shows the total uranium production from key uranium mining companies in 2009.
BHP Billiton had the Highest Uranium Reserves by the End of 2009
The total reserves of the uranium mining companies decreased from 697,177 tU in 2008 to 669,270 tU in 2009. BHP Billiton, Cameco Corporation, Areva, Rio Tinto Plc and Uranium One Inc. are the largest companies in terms of reserves as of 2009. In terms of increase in reserves, Paladin Energy Ltd is the best performer amongst its peer groups. The key uranium mining companies added 94,349 tU of reserves by the end of 2009.
Total Uranium Reserves, Key Uranium Mining Companies, Global, tU, 2009
Performance and Scope of Operations of the Key Uranium Mining Companies
With 31.4% return on capital employed, 29.9% return on fixed assets, Energy Resources of Australia Ltd was the top ranked company in terms of performance metrics in 2009. Paladin Energy was the fastest growing uranium mining company with a 227% growth in revenue during 2005-2009.
BHP Billiton stood first on scope metrics, ranking number one on both revenue and operating income parameters reflective of its large scale of operations. Rio Tinto ranked second on this metric on the same parameters in 2009. The figure below shows return on capital employed in terms of percentage for the key uranium mining companies in 2009.
Financial Performance of the 10 Key Uranium Mining Companies Adversely Affected by Economic Slowdown
The ongoing global financial crisis adversely affected the financial performance of the global key uranium companies. On the performance metrics, the 10 key uranium mining companies fared poorly in 2009 compared to 2005 on all the parameters considered namely, return on fixed assets and return on capital employed. Amongst the peer group, Energy Resources of Australia Limited ranked one in terms of return on fixed assets and return capital employed in 2009. BHP Billiton stood first on the scope metrics, ranking number one on both revenue and operating income parameters indicating the large scale of its operations. Rio Tinto ranked second on this metric on the same parameters in 2009.
Uranium Supply and Demand Outlook, 2010-2015
GlobalData foresees that uranium demand will increase at an Average Annual Growth Rate (AAGR) of 5% per year during the forecast period 2011-2020. Currently, 441 commercial nuclear reactors are operating globally as of December 2010. These nuclear reactors consume more than 65,000 tU annually. Some 65 new nuclear reactors are in the ‘under construction’ phase in 15 nuclear power countries across the globe. The operation of new nuclear reactors will increase the uranium demand during the next 10 years. Even the uranium prices are estimated to $80/lb by the end of 2015. More than 15 new uranium mines are expected to start commercial uranium mining and this will result in an increase in the uranium production during the period 2010-2015.
About GlobalData:
GlobalData is an industry analysis specialist company providing business information products and services.
Our highly qualified team of Analysts, Researchers, and Solution Consultants use proprietary data sources and various tools and techniques to gather, analyze and represent the latest and the most reliable information essential for businesses to sustain a competitive edge.
If you have any queries about this report or would like further information, please contact
North America: +1 646 395 5460
Europe: +44 207 936 6510
+44 1204 543 523
Asia Pacific: +91 40 6616 6700
Email: [email protected]
Disclaimer
All Rights Reserved.
No part of this publication may be reproduced, stored in a retrieval system or transmitted in any form by any means, electronic, mechanical, photocopying, recording or otherwise, without the prior permission of the publisher, GlobalData.
The facts of this report are believed to be correct at the time of publication but cannot be guaranteed. Please note that the findings, conclusions and recommendations that GlobalData delivers will be based on information gathered in good faith from both primary and secondary sources, whose accuracy we are not always in a position to guarantee. As such GlobalData can accept no liability whatever for actions taken based on any information that may subsequently prove to be incorrect.