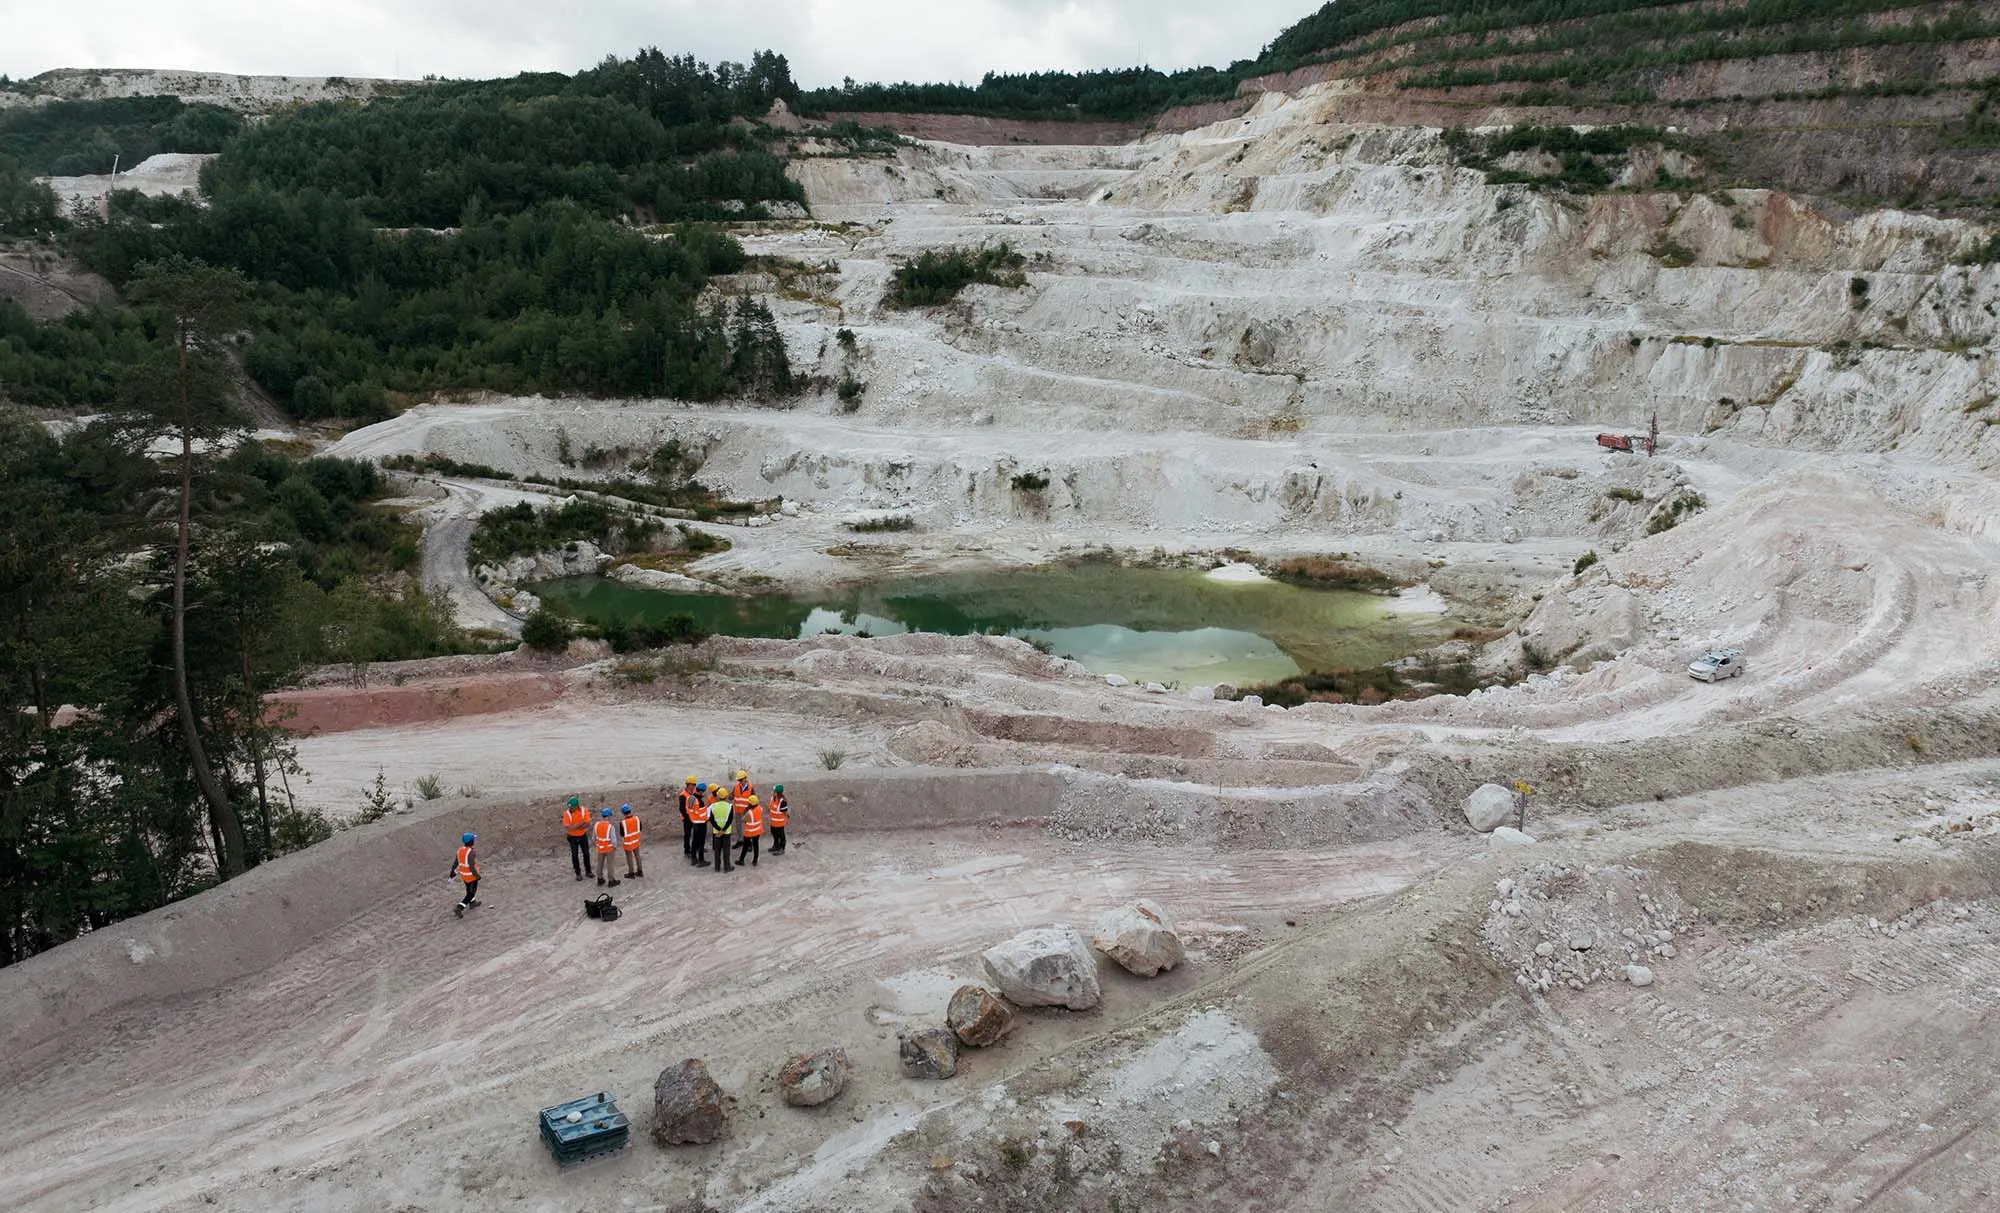
Finning delivers record earnings in Q2 2011

Finning International Inc. (TSX:FTT) –

Q2 2011 HIGHLIGHTS

--  Basic EPS was a record $0.48 for the quarter, up almost 130% from $0.21
    in Q2 2010.
--  Revenue climbed 39% to $1.5 billion fueled by exceptionally strong new
    equipment sales and record product support revenues.
--  EBIT almost doubled to $120 million. The Company benefited from improved
    operating leverage, and achieved EBIT margin of 8.1% compared to 5.9% in
    Q2 2010.
--  Backlog grew by 14% from March 2011 to $1.7 billion reflecting continued
    strong order intake.


Finning International Inc. (TSX:FTT) reported record quarterly basic earnings per share (EPS) of $0.48, up 129% over Q2 2010. Finning achieved Q2 2011 revenues of $1.5 billion, a 39% increase from Q2 2010. Earnings before interest and income taxes (EBIT) of $120 million were up by 91% from Q2 2010 and EBIT margin of 8.1% was significantly higher than 5.9% in Q2 2010. Improved EBIT margin performance reflected higher profitability in Canada and the UK & Ireland, as well as a solid performance in South America.

“Our outstanding performance in the second quarter reflects continued strong demand for our products and services coupled with significant improvement in our operating leverage. I am particularly pleased that we were able to deliver record earnings while continuing to advance our strategic initiatives,” said Mike Waites, president and CEO of Finning International Inc. “As we progressed through the second quarter, we continued to focus on building our customer service capabilities and developing opportunities for growth. Importantly, we entered into preliminary negotiations with Caterpillar regarding the potential purchase of certain distribution rights related to their recently announced Bucyrus acquisition. Aligned with our focus on operational excellence, we introduced a new enterprise resource planning system in our Canadian operations. This represents an important first step in a phased company-wide launch that will significantly enhance our ability to provide superior customer service while supporting our growth objectives.”

“The record earnings attest to our consistent execution and the strength of our business. As we look ahead, we are monitoring the current volatility in capital markets closely and are well positioned to adjust as necessary. We see significant opportunities for Finning and remain confident in our ability to deliver long-term sustainable growth,” concluded Mike Waites.

Results for the first half of the year have exceeded the Company’s expectations, driven by record product support revenues and exceptionally strong new equipment sales. The Company expects active market conditions to continue through the second half of the year. However, the Company anticipates that short-term challenges with its new enterprise resource planning (ERP) system, coupled with the five-week labour stoppage in B.C. will impact its Q3 2011 results in Canada.

The outlook for mining, construction and power systems markets for 2012 and 2013 remains strong. The Company is committed to driving ongoing profitability improvement and is making solid progress toward achieving its 10% EBIT margin target in 2013.

Q2 2011 FINANCIAL SUMMARY (from continuing operations)

Beginning with Q1 2011, the Company’s financial results are reported under IFRS (International Financial Reporting Standards)(1).


----------------------------------------------------------------------------
C$ millions, except per share amounts (unaudited)       Three months ended
                                                              June 30
                                                        2011   2010 % change
----------------------------------------------------------------------------
Revenue                                                1,481  1,065       39
Earnings before interest and income taxes (EBIT) (2)     120     63       91
Net income                                                82     36      129
Basic EPS                                               0.48   0.21      129
Earnings before interest, income taxes, depreciation
and amortization (EBITDA) (2)                            160     98       64
Free cash flow (2)(3)                                   (227)    15      n/m
----------------------------------------------------------------------------

--  Revenues of $1.5 billion were up 39% from Q2 2010, reflecting higher new
    equipment sales and product support revenues in all operations. New
    equipment sales increased by 68% and product support revenues grew by
    24% to a new record, driven by continued strength in market activity
    across all sectors. Used equipment sales declined by 14% due to lower
    sales in Canada, where quality used equipment remains in short supply.
    Rental revenues were 38% higher reflecting strong demand.

--  Gross profit increased by 33% from Q2 2010. Gross profit margin declined
    to 29.7% from 31.0% as revenue mix shifted in favour of new equipment
    sales in all operations, with a pronounced shift in South America
    reflecting the deliveries of large mining equipment in the quarter. New
    equipment sales contributed 47% to the total revenue compared to 38% in
    Q2 2010, while product support comprised 43% of the total revenue
    compared to 48% in Q2 of last year.

--  Selling, general and administrative (SG&A) expenses as a percentage of
    revenue decreased to 21.3% from 24.5% in Q2 2010 as a result of
    leveraging high sales volumes and an on-going focus on cost management
    and productivity and efficiency improvements. The Company remains
    committed to driving SG&A expenses as a percentage of revenue down to
    approximately 20% in the medium term.

--  The Company continued to demonstrate significant improvement in its
    operating leverage in the quarter. EBIT increased by 91% to $120 million
    and consolidated EBIT margin rose to 8.1% from 5.9% in Q2 2010,
    reflecting much higher profitability in Canada and the UK & Ireland, and
    solid EBIT performance in South America. The Company continues to drive
    sustainable EBIT margin improvement in all operations as it progresses
    towards achieving a 10% consolidated EBIT margin in the medium term.

--  Net income increased by 129% to $82 million, and basic EPS of $0.48 set
    a quarterly earnings record. Foreign exchange had a negative impact of
    $0.05 per share compared to Q2 2010.

--  EBITDA, which is an indicator of a company's cash operating performance,
    was up by 64% to $160 million. Quarterly free cash flow was a $227
    million use of cash, compared to $15 million cash generation in Q2 2010.
    As expected, significantly stronger demand for equipment and parts drove
    higher working capital requirements, particularly inventory and
    receivables. The Company continues to manage its working capital
    aggressively and monitor its working capital metrics closely to ensure a
    strong balance sheet. The Company expects inventory requirements to
    moderate and projects a positive free cash flow for the second half of
    2011. Despite this trend, free cash flow is expected to be negative for
    the full year and will be primarily driven by the level of working
    capital required.

--  The net debt to total capital ratio was 45.6% compared to 40.3% at the
    end of March 2011, reflecting a decrease in cash levels to support
    growth in working capital. With positive cash generation expected in the
    second half of the year, the net debt to total capital ratio is expected
    to remain within the Company's target range by the end of 2011.

--  Consolidated backlog increased by 14% from March 2011 to $1.7 billion,
    as a result of higher order intake in all operations.

Q2 2011 HIGHLIGHTS BY OPERATIONS

Canada


--  Second quarter revenues rose by 33% from Q2 2010, with new equipment
    sales and product support revenues up by 54% and 32% respectively. New
    equipment sales were particularly strong in mining and also continued to
    gain pace in heavy construction. Product support revenues set a new
    record in Q2 2011 due to increased demand for parts, component repairs
    and machine rebuilds. This strong demand is driven by change-out cycles
    for the large population of mining equipment as well as higher
    utilization of heavy construction fleets.

--  SG&A costs as a percentage of revenue declined relative to Q2 2010 as a
    result of leverage to higher sales volumes, focused expense management
    and improved productivity and operational efficiencies.

--  Second quarter EBIT of $66 million was up by 91% from Q2 2010,
    reflecting significantly higher new equipment sales, record product
    support revenues with strong parts volume, improved gross profit margins
    and decreased SG&A as a percentage of revenue. Continued improvement in
    operating leverage generated a much higher quarterly EBIT margin of 9.0%
    compared to 6.2% in Q2 2010. Finning Canada continues to make solid
    progress towards driving sustainable improvement in profitability and
    achieving its medium-term EBIT margin target of 10%.

--  Backlog increased further from Q1 2011 driven by robust order intake
    from mining and heavy construction.

--  On July 4, the Company launched a new ERP system in Canada that will
    generate long-term operational benefits to Finning. The new system is
    operational and the Company is able to transact business across the
    enterprise. Typical start-up challenges did occur and they are being
    addressed. An issue arose impacting the efficiency of parts warehousing
    and distribution operations which have run at reduced capacity since go-
    live. Considerable progress has been made in implementing solutions to
    efficiently receive and ship parts, and the Company expects to be back
    to normal parts supply levels at its Canadian operations by the end of
    the third quarter.

South America


--  Second quarter revenues increased by 51% from Q2 2010 to a new record,
    driven by strong new equipment sales in mining and construction and
    solid growth in product support. In functional currency (USD), revenues
    were up 61% from Q2 2010. Quarterly new equipment sales in functional
    currency more than doubled driven by deliveries of large mining
    equipment in Chile and continued strong demand from the construction
    industry throughout our South American operations. Product support
    revenues continued to show excellent growth across all sectors and were
    up by 22% in functional currency.
--  SG&A costs as a percentage of revenue improved compared to Q2 2010 and
    recent quarters. Managing cost pressures remains a key focus area, as
    the Company is experiencing strong business volumes and a tight and
    competitive labour market.
--  EBIT of $48 million was up by 46% compared to Q2 2010 (in functional
    currency, the increase was 56%). EBIT margin of 9.1% was only slightly
    below 9.4% in Q2 2010, despite a significant shift in revenue mix to new
    equipment sales which earn a lower gross profit margin. New equipment
    accounted for 53% of the total revenue with product support contributing
    41%, the exact opposite of the revenue mix in Q2 2010.
--  Order intake was strong in Q2 2011, reflecting very active mining,
    infrastructure and energy sectors, and driving a higher backlog compared
    to the end of March 2011.

United Kingdom and Ireland (continuing operations)


--  Quarterly revenues were up 34% from Q2 2010 driven by improved activity
    in the heavy construction and power systems sectors, as well as the
    incremental revenues from the Irish operations. In functional currency
    (GBP), quarterly revenues increased by 30%, with a 46% increase in new
    equipment sales and a 16% increase in product support revenues.

--  EBIT improved to $13 million from $0.5 million in Q2 2010. EBIT margin
    improved significantly to 6.0% compared to 0.3% in Q2 2010 due to higher
    volumes and reduced SG&A costs as a percentage of revenue. Higher
    profitability was achieved despite a very competitive market environment
    affecting gross profit margins in product support, and a shift in
    revenue mix to a higher proportion of new equipment sales, from 53% of
    total revenue in Q2 2010 to 59% in Q2 2011. The Company expects to
    continue to make solid progress towards achieving a 7% to 8% EBIT margin
    in the UK and Ireland in the medium term.

--  While the UK economic outlook remains uncertain, order intake for the
    construction and power systems segments remains active. In addition, the
    Company continues to execute well on its distribution strategy for
    smaller equipment.

CORPORATE AND BUSINESS DEVELOPMENTS

Bucyrus Distribution Business

Finning has entered into preliminary discussions with Caterpillar regarding the possible purchase of certain distribution assets owned by Caterpillar through its recently completed acquisition of Bucyrus, a leading manufacturer of high productivity mining equipment for the surface and underground mining industries. Due to the preliminary nature of these discussions, no assurance can be given that any transaction will occur or concerning the terms, conditions or timing of any such transaction. If those discussions are successful and a definitive agreement is entered into between Finning and Caterpillar, Finning will provide appropriate disclosure regarding the terms of the arrangement. Until such time, Finning does not intend to provide any further comments regarding the progress of negotiations or the terms of any potential agreement.

Dividend

The Board of Directors approved a quarterly dividend of $0.13 per share; payable on September 9, 2011, to shareholders of record on August 26, 2011.This dividend will be considered an eligible dividend for Canadian income tax purposes.


SELECTED CONSOLIDATED FINANCIAL INFORMATION: Q2 2011
(from continuing operations unless otherwise stated, C$ millions, except per
share amounts)
                  ----------------------------------------------------------
                  ----------------------------------------------------------
                   Three months ended June 30    Six months ended June 30
                  ----------------------------------------------------------
                  ----------------------------------------------------------
Revenue               2011      2010  % change     2011      2010  % change
                  ----------------------------------------------------------
  New equipment      689.2     409.3        68  1,238.0     753.2        64
  Used equipment      71.0      82.7       (14)   122.6     145.3       (16)
  Equipment rental    81.8      59.1        38    160.1     125.5        28
  Product support    635.7     511.8        24  1,228.2   1,003.4        22
  Other                2.9       2.1        38      6.3       4.5        40
----------------------------------------------------------------------------
    Total revenue  1,480.6   1,065.0        39  2,755.2   2,031.9        36
----------------------------------------------------------------------------
Gross profit         440.0     330.1        33    837.3     621.6        35
Gross profit
 margin(4)            29.7%     31.0%              30.4%     30.6%

SG&A                (315.8)   (260.8)      (21)  (602.1)   (500.0)      (20)
SG&A as a
 percentage of
 revenue             (21.3)%   (24.5)%            (21.9)%   (24.6)%

Equity earnings        1.0       0.8                1.8       0.7

Other expenses        (5.6)     (7.5)       25    (10.8)    (15.5)       30
----------------------------------------------------------------------------
EBIT(2)              119.6      62.6        91    226.2     106.8       112
EBIT margin(5)         8.1%      5.9%               8.2%      5.3%
----------------------------------------------------------------------------

Income from
 continuing
 operations           81.9      35.7       129    153.4      62.2       147
Loss from
 discontinued
 operations, net
 of tax                  -    (123.2)                 -    (125.0)
----------------------------------------------------------------------------
Net income (loss)     81.9     (87.5)             153.4     (62.8)
----------------------------------------------------------------------------

Basic earnings
 (loss) per share
 (EPS)
  from continuing
   operations         0.48      0.21       129     0.89      0.36       147
  from
   discontinued
   operations            -     (0.72)                 -     (0.73)
----------------------------------------------------------------------------
Total basic
 earnings (loss)
 per share            0.48     (0.51)              0.89     (0.37)
----------------------------------------------------------------------------

EBITDA(2)            160.1      97.7        64    307.6     184.1        67
Free Cash
 Flow(i)(2)(3)      (226.8)     14.6       n/m   (383.2)    116.5       n/m
----------------------------------------------------------------------------
----------------------------------------------------------------------------
                                                 June 30, 11     Dec 31, 10
                                             -------------------------------
Total assets                                         3,645.0        3,429.7
Total shareholders' equity                           1,290.9        1,203.0
Net debt to total capital(6)                            45.6%          35.3%
----------------------------------------------------------------------------
----------------------------------------------------------------------------

(i) Free cash flow from Hewden has been included in the figures for periods
prior to the sale.

To download Finning’s complete Q2 2011 results in PDF, please open the following link: http://media3.marketwire.com/docs/FinningQ211results.pdf

To download the CEO and CFO certification letters once they have been filed on SEDAR, please open the following link: http://www.sedar.com/DisplayCompanyDocuments.do?lang=EN&issuerNo=00001068

Q2 2011 RESULTS INVESTOR CALL

Management will hold an investor conference call on Friday, August 12 at 11:00 am Eastern Time. Dial-in numbers: 1-866-223-7781 (anywhere within Canada and the U.S.) or (416) 340-8018 (for participants dialing from Toronto and overseas).

The call will be webcast live and subsequently archived at www.finning.com. Playback recording will be available at 1-800-408-3053 from 1:00 pm Eastern Time on August 12 until August 19. The pass code to access the playback recording is 4463383 followed by the number sign.

ABOUT FINNING

Finning International Inc. (TSX:FTT) is the world’s largest Caterpillar equipment dealer delivering unrivalled service to customers since 1933. Finning sells, rents and services equipment and engines to help customers maximize productivity. Headquartered in Vancouver, B.C., the Company operates in western Canada, Chile, Argentina, Bolivia, Uruguay, as well as in the United Kingdom and Ireland.

Footnotes


1.  Beginning in 2011, our results are now being prepared in accordance with
    International Financial Reporting Standards ("IFRS"). Our accounting
    policies have changed and the presentation, financial statement captions
    and terminology used in this news release and the accompanying unaudited
    financial statements differ from that used in all previously issued
    financial statements and quarterly and annual reports. The new policies
    have been consistently applied to all of the years presented in this
    news release and all prior period information has been restated or
    reclassified for comparative purposes unless otherwise noted. Further
    details on the conversion to IFRS are provided in the management's
    discussion and analysis section of this news release and in the notes to
    our unaudited consolidated financial statements as at and for the
    quarter ended June 30, 2011.

2.  These amounts do not have a standardized meaning under generally
    accepted accounting principles. For a reconciliation of these amounts to
    net income and cash flow from operating activities, see the heading
    "Description of Non-GAAP Measures" in the Company's management
    discussion and analysis that accompanies the second quarter consolidated
    financial statements.

3.  Free cash flow is defined as cash flow provided by (used in) operating
    activities less net property, plant and equipment expenditures.

4.  Gross profit margin is defined as gross profit as a percentage of total
    revenue.

5.  EBIT margin is defined as earnings before interest and income taxes as a
    percentage of total revenue.

6.  Net debt to total capital ratio is calculated as short-term debt and
    long-term debt, net of cash and cash equivalents (net debt) divided by
    total capitalization. Total capitalization is defined as the sum of net
    debt and all components of equity (share capital, contributed surplus,
    accumulated other comprehensive loss, and retained earnings).

Forward-Looking Disclaimer

This report contains statements about the Company’s business outlook, objectives, plans, strategic priorities and other statements that are not historical facts. A statement we make is forward-looking when it uses what we know and expect today to make a statement about the future. Forward-looking statements may include words such as aim, anticipate, assumption, believe, could, expect, goal, guidance, intend, may, objective, outlook, plan, project, seek, should, strategy, strive, target, and will. Forward-looking statements in this report include, but are not limited to, statements with respect to: expectations with respect to the economy and associated impact on the Company’s financial results; expected revenue and SG&A levels and EBIT growth; anticipated generation of free cash flow (including projected net capital and rental expenditures), and its expected use; anticipated defined benefit plan contributions; the expected target range of Debt Ratio; the expected quantitative impact on the 2010 consolidated statements of financial position and statements of income and comprehensive income of the Company’s transition to IFRS effective January 1, 2010; and the impact on new and revised IFRS that have been issued but are not yet effective. All such forward-looking statements are made pursuant to the ‘safe harbour’ provisions of applicable Canadian securities laws.

Unless otherwise indicated by us, forward-looking statements in this report describe our expectations at August 12, 2011. Except as may be required by Canadian securities laws, we do not undertake any obligation to update or revise any forward-looking statement, whether as a result of new information, future events, or otherwise.

Forward-looking statements, by their very nature, are subject to numerous risks and uncertainties and are based on several assumptions which give rise to the possibility that actual results could differ materially from our expectations expressed in or implied by such forward-looking statements and that our business outlook, objectives, plans, strategic priorities and other statements that are not historical facts may not be achieved. As a result, we cannot guarantee that any forward-looking statement will materialize. Factors that could cause actual results or events to differ materially from those expressed in or implied by our forward-looking statements include: general economic and market conditions; foreign exchange rates; commodity prices; the level of customer confidence and spending, and the demand for, and prices of, our products and services; our dependence on the continued market acceptance of Caterpillar’s products and Caterpillar’s timely supply of parts and equipment; our ability to continue to improve productivity and operational efficiencies while continuing to maintain customer service; our ability to manage cost pressures as growth in revenues occur; our ability to attract sufficient skilled labour resources to meet growing product support demand; our ability to negotiate and renew collective bargaining agreements with satisfactory terms for our employees and the Company; the intensity of competitive activity; our ability to raise the capital we need to implement our business plan; regulatory initiatives or proceedings, litigation and changes in laws or regulations; stock market volatility; changes in political and economic environments for operations; the integrity, reliability, and availability of technology and the data processed by that technology; new or amended IFRS or interpretations that become effective prior to the inclusion of the Company’s financial statement of position in its first annual audited IFRS financial statements. Forward-looking statements are provided in this report for the purpose of giving information about management’s current expectations and plans and allowing investors and others to get a better understanding of our operating environment. However, readers are cautioned that it may not be appropriate to use such forward-looking statements for any other purpose.

Forward-looking statements made in this report are based on a number of assumptions that we believed were reasonable on the day we made the forward-looking statements. Refer in particular to the Outlook section of the MD&A. Some of the assumptions, risks, and other factors which could cause results to differ materially from those expressed in the forward-looking statements contained in this report are discussed in the Company’s current Annual Information Form (AIF) in Section 4.

We caution readers that the risks described in the AIF are not the only ones that could impact us. Additional risks and uncertainties not currently known to us or that we currently deem to be immaterial may also have a material adverse effect on our business, financial condition, or results of operations.

Except as otherwise indicated by us, forward-looking statements do not reflect the potential impact of any non-recurring or other unusual items or of any dispositions, mergers, acquisitions, other business combinations or other transactions that may be announced or that may occur after the date hereof. The financial impact of these transactions and non-recurring and other unusual items can be complex and depends on the facts particular to each of them. We therefore cannot describe the expected impact in a meaningful way or in the same way we present known risks affecting our business