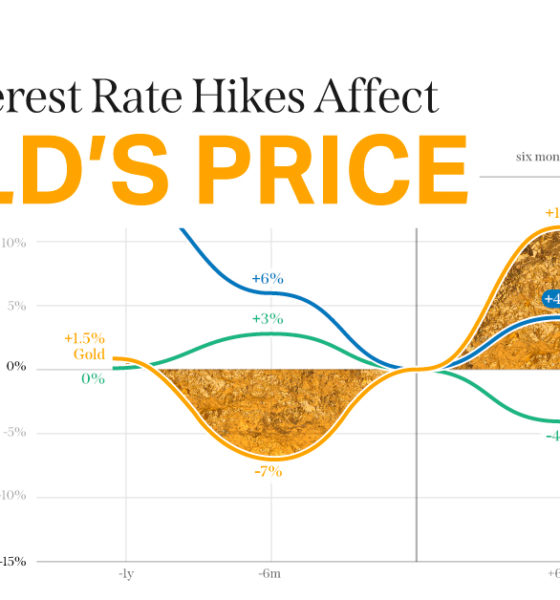
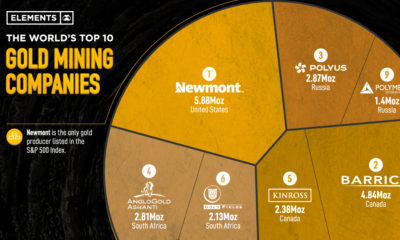
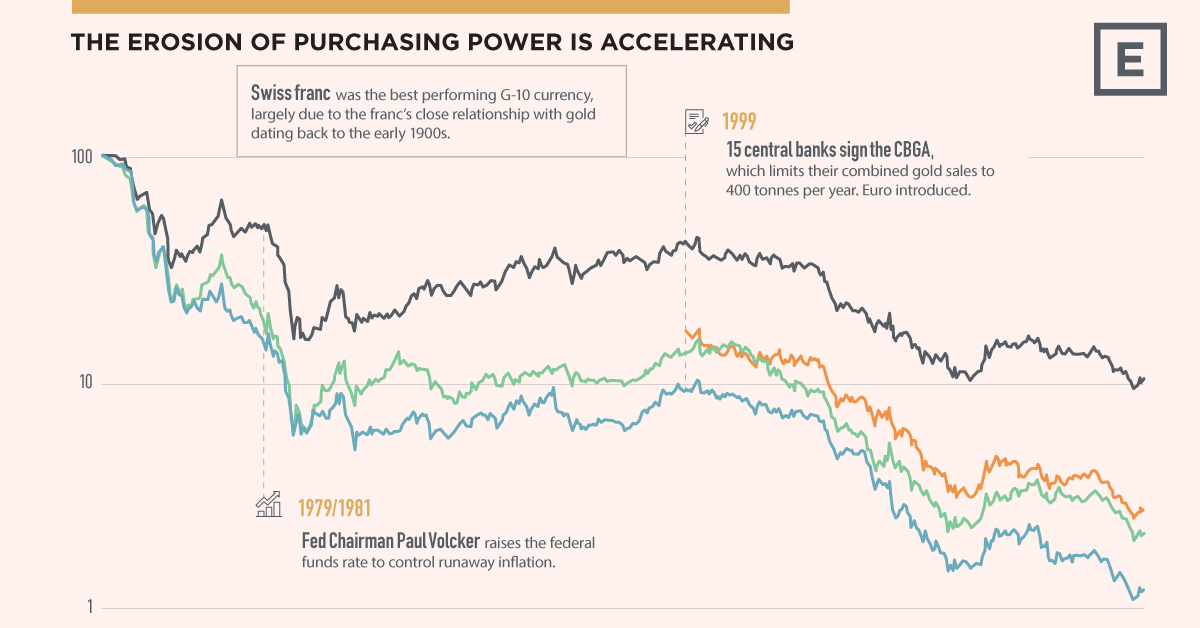
Lithium prices surge on EV demand from China Global EV sales were on track to hit 6.3 million units in 2021—nearly double the total of 2020. Visual Capitalist - Elements | January 27, 2022 | 3:58 pm
Chart: How metals prices performed in 2021 Looking back on what gave investors strong returns in 2021, it was the year of industrial and energy metals. Visual Capitalist - Elements | January 24, 2022 | 6:36 pm
Visualizing China’s dominance in clean energy metals 
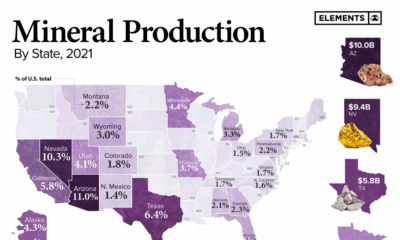
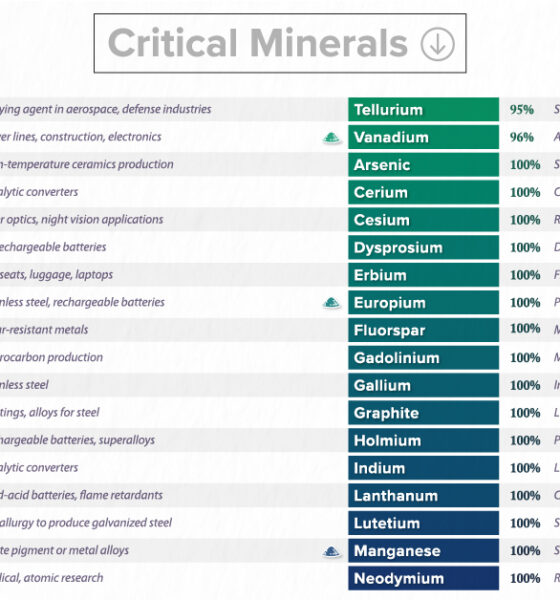
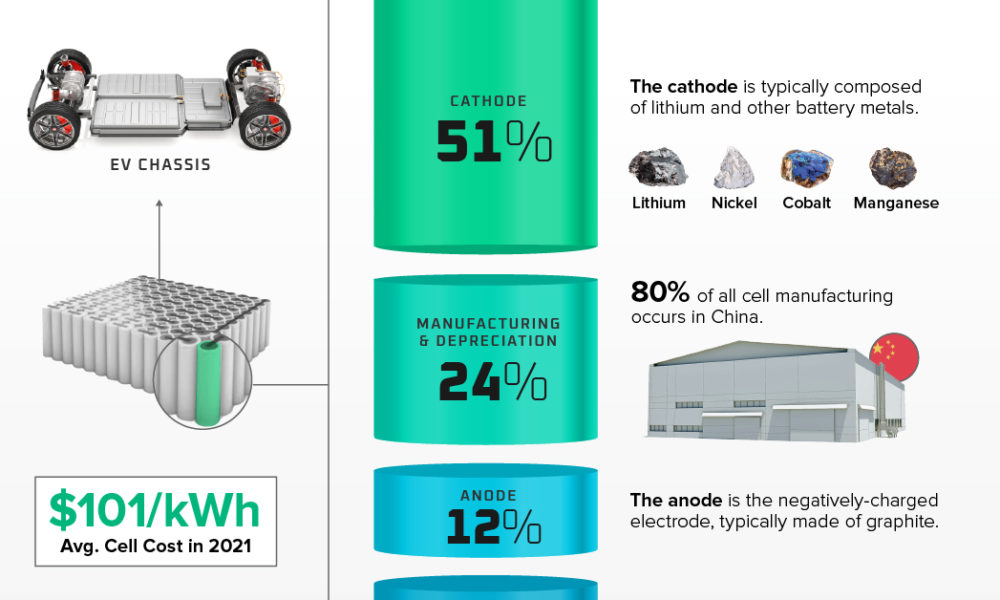
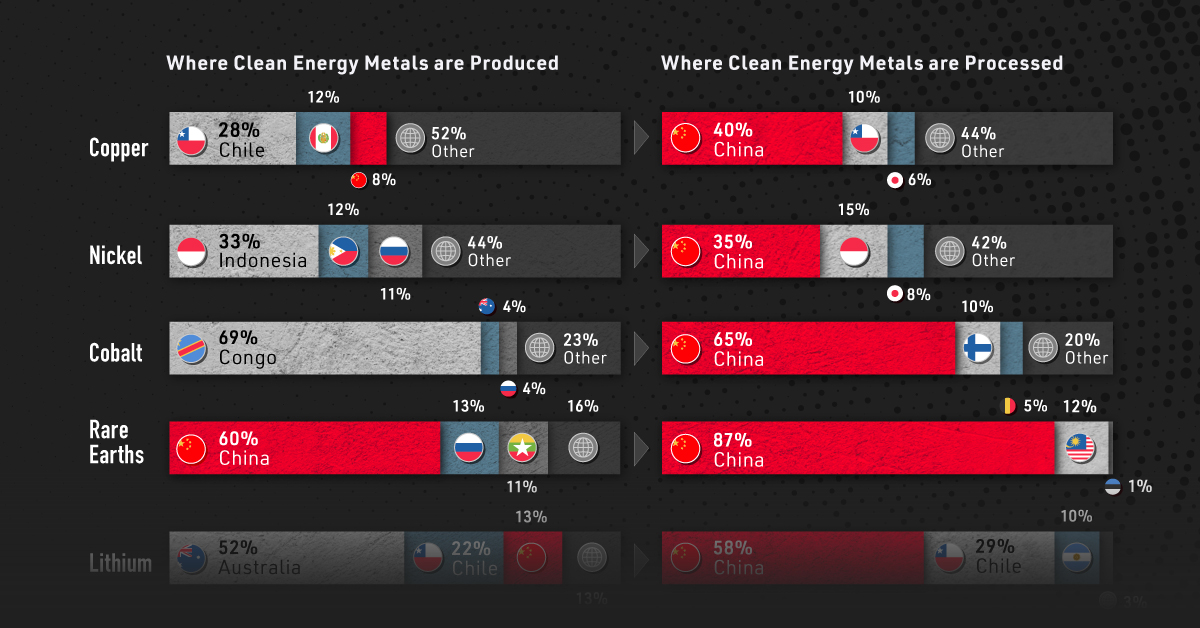
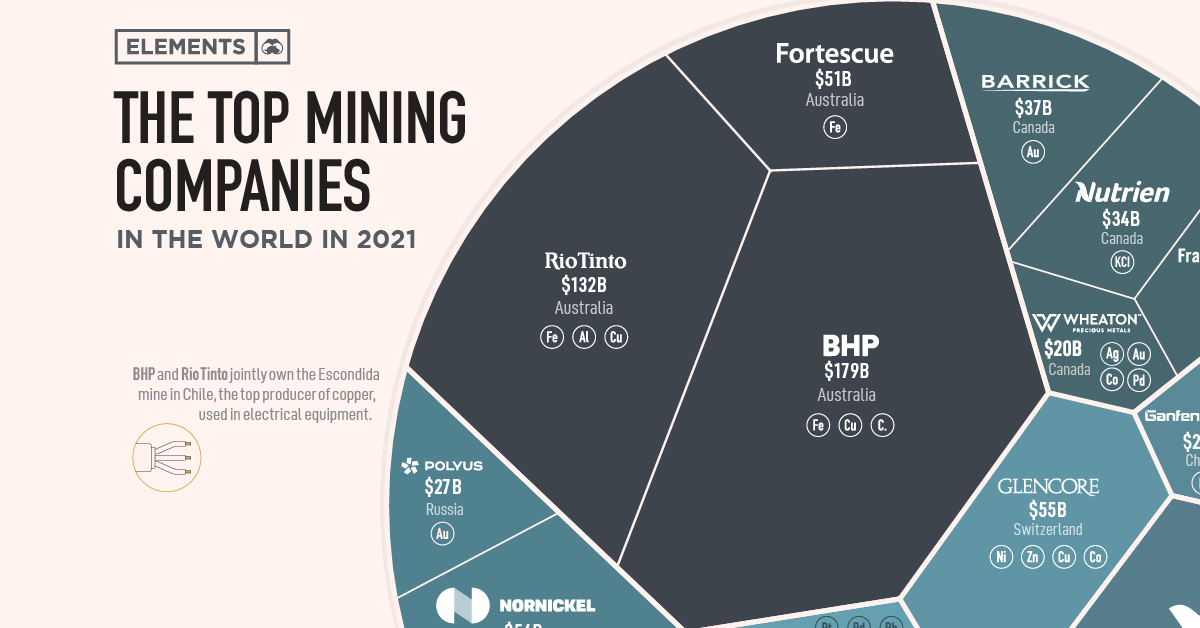
In the race to secure raw materials needed for the green revolution, new world powers could emerge as demand for clean energy metals grows. For now, China has the lead. Visual Capitalist - Elements | January 20, 2022 | 11:13 am
Electric car companies: Visualizing the race for EV dominance This graphic based on data from EV Volumes compares Tesla and other top carmakers’ positions today and gives market share projections for 2025. Visual Capitalist - Elements | November 8, 2021 | 5:54 pm
The world’s top 10 gold mining companies Together, the world’s top 10 gold miners produced 27.48 million ounces in 2020, worth approximately $48 billion. Visual Capitalist - Elements | October 20, 2021 | 9:16 am
The biggest mining companies in the World in 2021 The graphic takes a look at the world’s largest mining companies by market capitalization and the metals they produce. Visual Capitalist - Elements | August 4, 2021 | 8:39 pm
Visualizing the power of gold versus currencies Since the gold standard was abandoned in 1971, the relationship in value between currencies and gold has moved in only one direction: down. Visual Capitalist - Elements | July 9, 2021 | 10:44 am