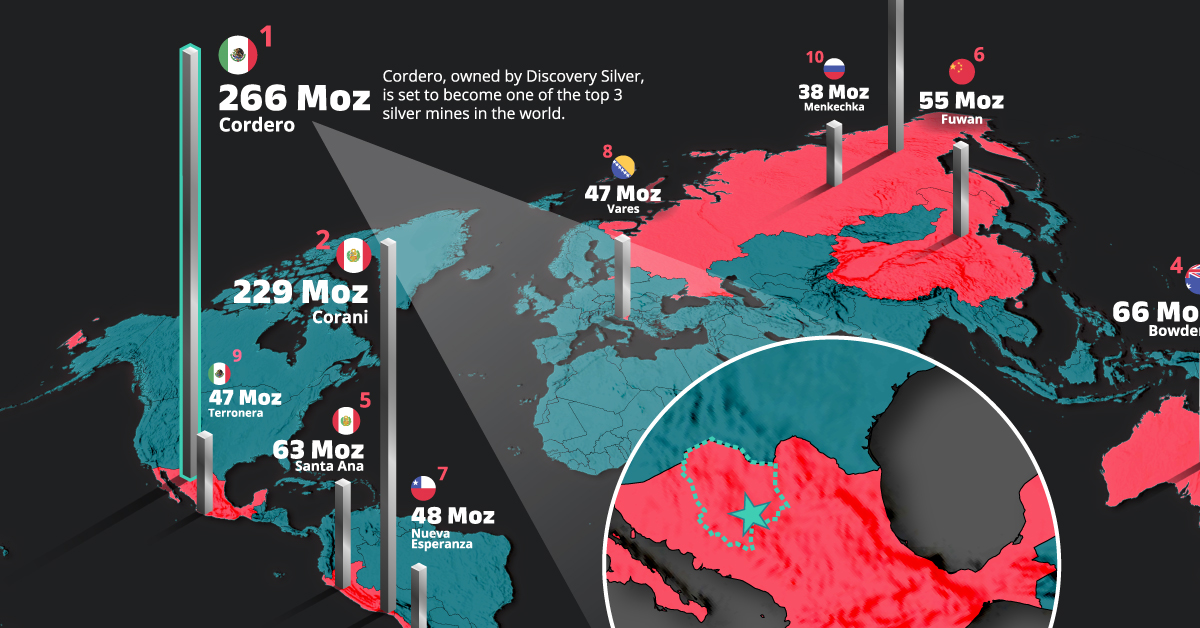
Mapped: The 10 largest undeveloped silver deposits in the world Global silver demand is poised to soar in the next decade, driven by emerging technologies like electric vehicles and solar power. Visual Capitalist - Elements | August 11, 2023 | 7:13 am
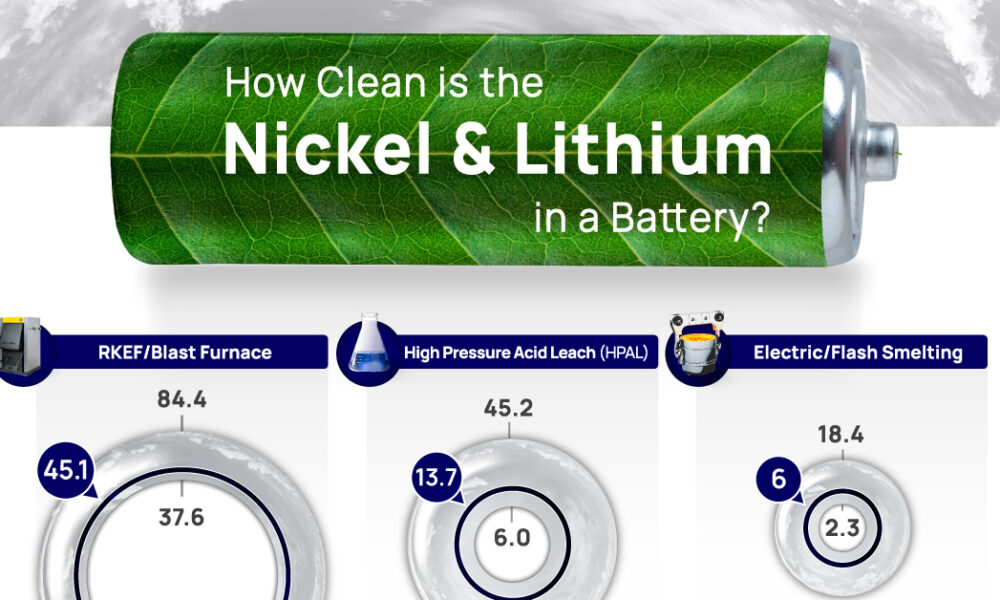
How clean is the nickel and lithium in a battery? The production of lithium and nickel can produce vastly different emissions profiles. Visual Capitalist - Elements | July 25, 2023 | 10:17 am
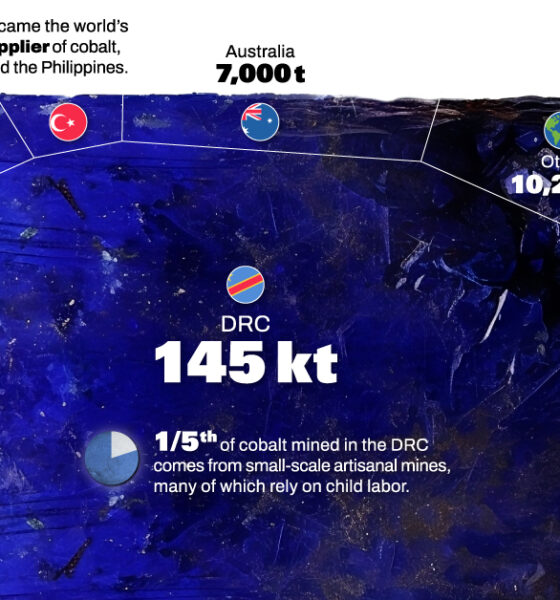
Ranked: The world’s top cobalt producing countries Cobalt, an essential component for certain types of EV batteries, has seen a significant shift in its global production landscape. Visual Capitalist - Elements | July 24, 2023 | 9:00 am
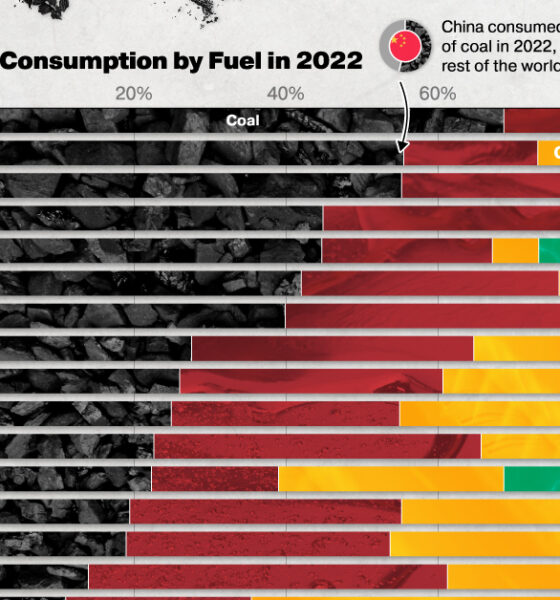
Which countries are most reliant on coal? Coal is the largest source of electricity generation and the primary fuel for iron, steel, and cement production, making it central to climate and energy discussions. Visual Capitalist - Elements | July 12, 2023 | 9:03 am
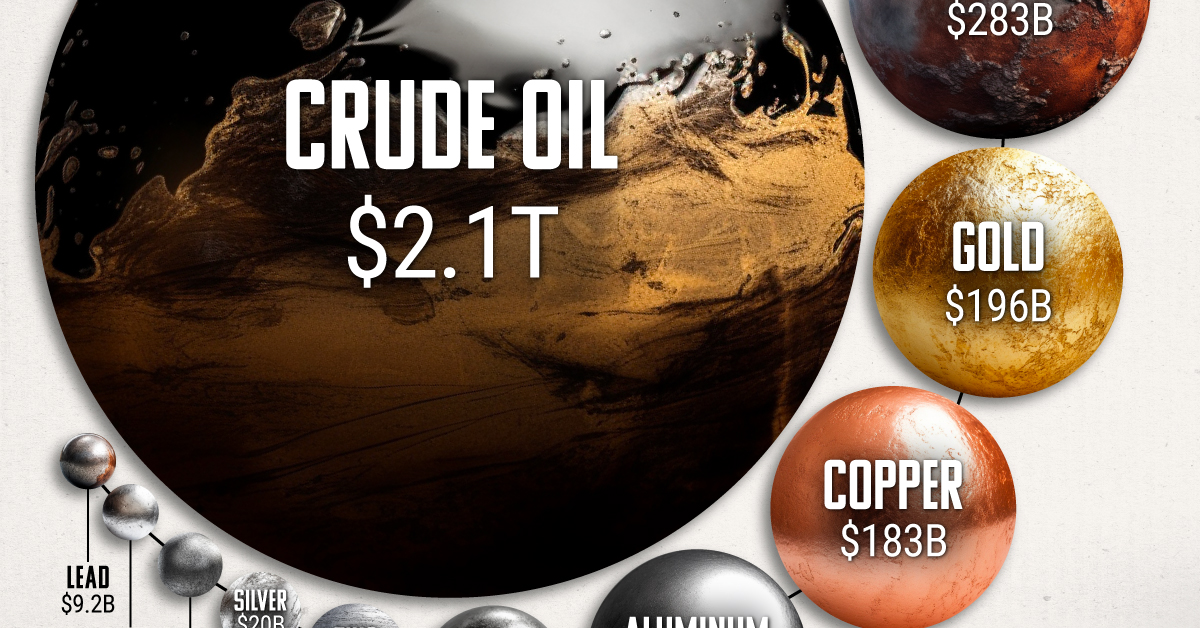
Sizing up: The oil market vs Top 10 metal markets combined The oil market is bigger than the 10 largest metal markets combined, with production value exceeding $2 trillion annually. Visual Capitalist - Elements | July 4, 2023 | 8:33 am
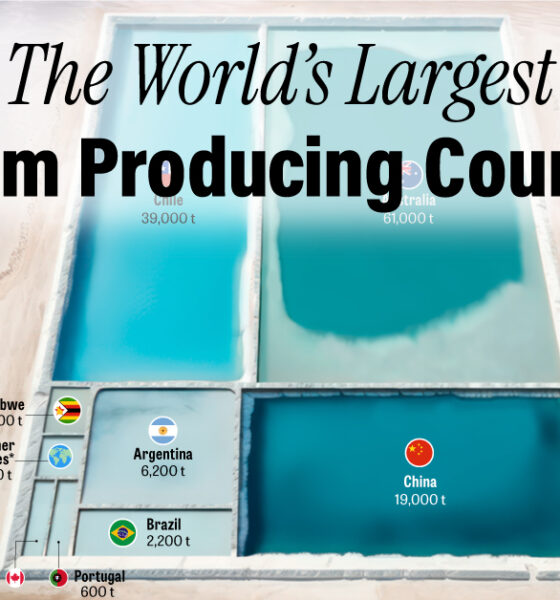
Visualizing the world’s largest lithium producers The global lithium-ion battery market was valued at $52 billion in 2022 and is expected to reach $194 billion in 2030. Visual Capitalist - Elements | June 12, 2023 | 11:29 am
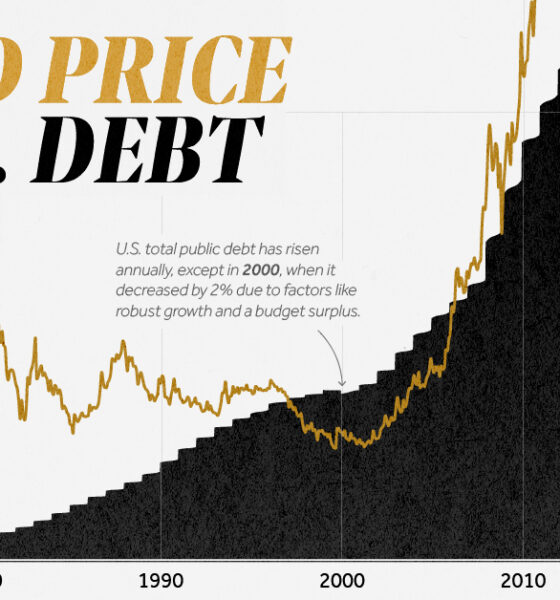
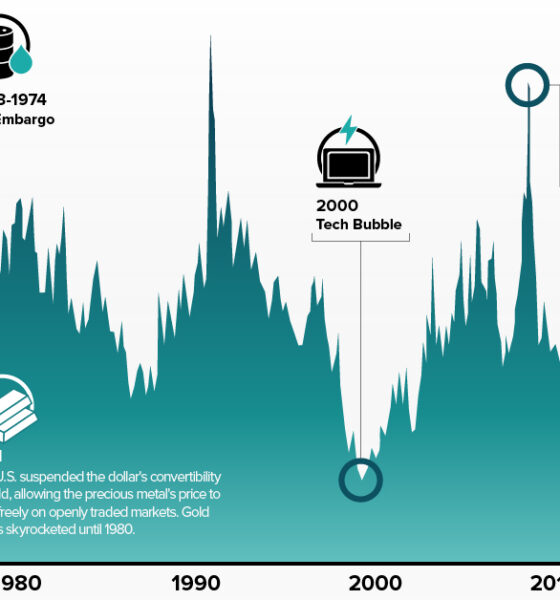
Visualizing gold price and US debt (1970-2023) This graphic explores the relationship between gold price and the U.S. national debt. Visual Capitalist - Elements | June 8, 2023 | 11:19 am
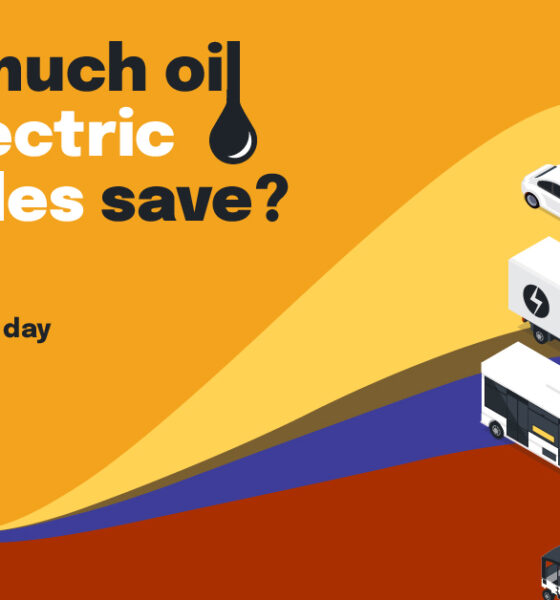
How EV adoption will impact oil consumption (2015-2025P) How much oil has been and will be saved every day by various types of electric vehicles? Visual Capitalist - Elements | May 11, 2023 | 12:28 pm
Charted: Commodities vs equity valuations (1970–2023) The commodities-to-equities ratio recently hit a 50-year low. In the past, when this ratio reached such levels, commodity supercycles began. Visual Capitalist - Elements | May 2, 2023 | 9:39 am
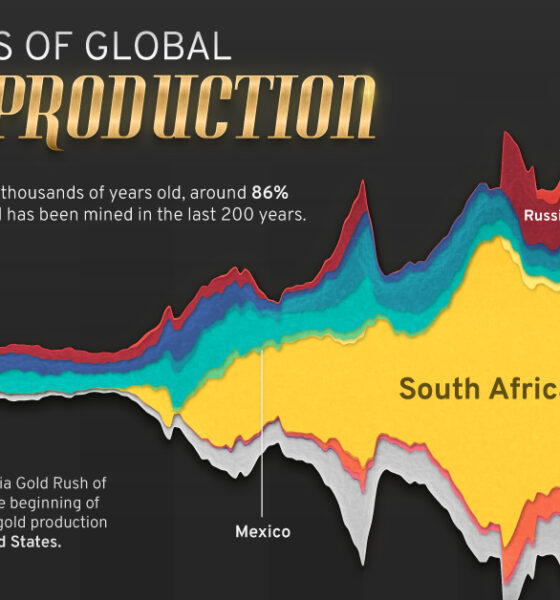
CHART: 200 years of global gold production, by country This infographic uses data from Our World in Data to visualize global gold production by country from 1820 to 2022. Visual Capitalist - Elements | April 26, 2023 | 11:39 am
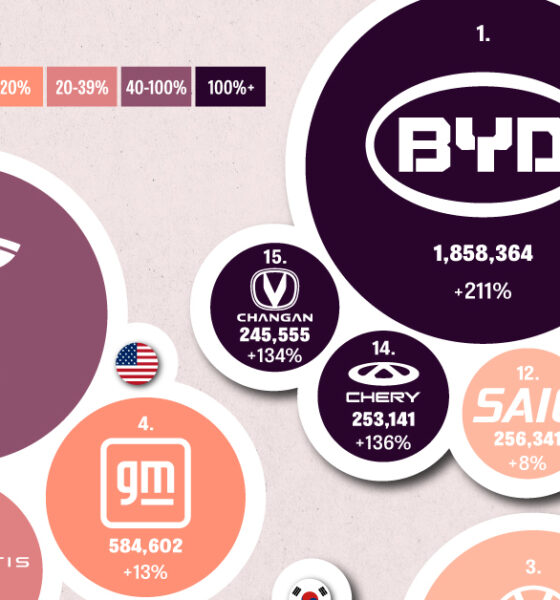
Visualizing global EV production in 2022, by brand This graphic explores the latest EV production data for 2022, showing BYD taking a massive step forward to surpass Tesla. Visual Capitalist - Elements | April 20, 2023 | 11:27 am
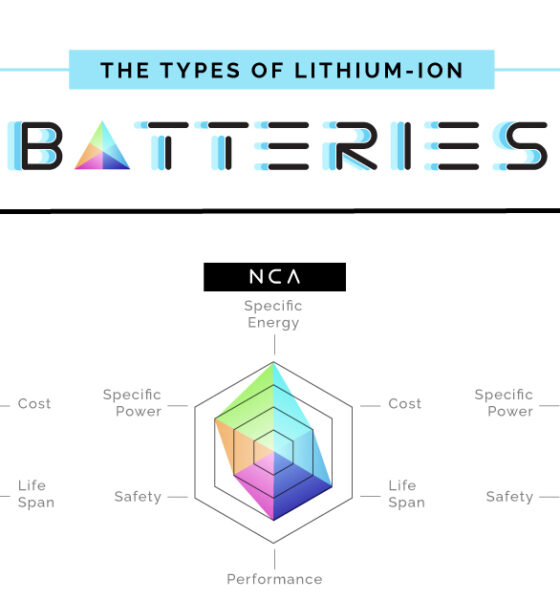
Graphic: The Six Major Types of Lithium-ion Batteries This infographic shows the tradeoffs between the six major lithium-ion cathode technologies. Visual Capitalist - Elements | April 19, 2023 | 9:36 am