 Many people missed the market’s enormous appreciation during the latest equity bull market because they were late to the game or chose to sit on the sidelines. The sideline is a crowded place these days as investors have been reluctant to fully embrace equities.
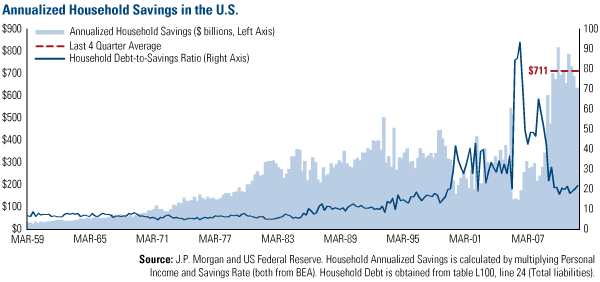
Household savings for the past 12 months totaled $711 billion, the highest level ever recorded in dollar terms. You can see from the chart that’s roughly double the amount of savings recorded following the Tech Bubble. In fact, household debt-to-savings ratios are currently at levels so low, they’ve not been seen since the mid-1990s.

If you’re one of the people on the sidelines who has been debating whether to get your feet wet in today’s market—now could be your chance.
After peaking in late April, the S&P 500 Index declined for nearly seven-straight weeks before bouncing sharply last week. J.P. Morgan research says a seven-consecutive-week losing streak is an extremely rare occurrence during bull markets, only occurring once before in March 1980. That year, the market rallied 15 percent over the next three months.
Historically, summer’s arrival has been good for the market. J.P. Morgan analysts researched the S&P 500’s performance during the June-August period over the last 111 years. They discovered that markets have risen 3 percent on average during this period, with pretty high frequency of up years (roughly 60 percent). During bull markets, which we believe we’re currently in, the S&P 500 averaged 5 percent with up years 77 percent of the time.
However, recently there have been some notable divergences from historical norms. The S&P 500 rose 11 percent from June through August in 2009, but lost 4 percent in 2010 over the same time period.
One reason we think the market will rise during the second half of 2011 is that sentiment has grown pervasively negative in recent weeks. The American Association of Individual Investors (AAII) survey of investor sentiment, a popular contrarian indicator, showed 77 percent of individuals were bearish in June, one of the lowest readings since the beginning of this bull market in March 2009, according to J.P. Morgan.
Citigroup research also showed the pendulum has swung too far toward negativity. Their Panic/Euphoria Model, a proprietary combination of nine facets of investor beliefs and fund manager actions, gauges the mood toward the market. Overly bullish territory (Euphoria) generally signals a market correction is on its way, while a recovery arrives when sentiment is overly pessimistic (Panic).

Market sentiment fell into a “panic” at the end of June, which is a good sign for investors. Citigroup says there’s roughly a 90 percent chance markets could move higher over the next six months—and a 97 percent chance over the next year—according to historical data. On average, the market bounces 8.9 percent the following six months and 17.3 percent the following year.
It’s likely that ardent followers of Dow Theory can hardly contain their excitement. This technical indicator for the Dow Jones Industrial Average (DJIA) is on the verge of confirming the market’s bull status. Marketwatch’s Mark Hulbert wrote last week that a bull market would be confirmed by Dow Theory if the DJIA closes above its April high of 12,810.54. Friday’s close left the DJIA 153 points (about 1 percent) shy of that mark.
Luckily, in addition to the indicators outlined above, market signs are indicating it soon will. Hulbert says the two S&P sectors to watch are industrials and transportation. The DJ-Transportation Index has already topped previous highs but industrials have “refused to join.” After yesterday’s move higher, industrials were only about 1 percent shy—the same as the DJIA overall—from previous highs.
If this technical data doesn’t convince you, maybe improvement in the global economy will. It’s true Friday’s jobs report was dismal and second-quarter 2011 U.S. GDP growth is expected to come in around 2 percent for the second-straight quarter. However, there were several encouraging developments last week.
We received our first dose of clarity on the Greece sovereign debt issue and it looks like calamity has been averted. The Chinese government, which has been tightening policies to keep the country’s economy from overheating, announced its third interest rate hike this year. This likely is the end of China’s tightening measures and its economy should react positively.
There’s also positive momentum building for the U.S. economy. Manufacturing strength is the foundation of a growing economy, and currently both the services and manufacturing Purchasing Managers Index (PMI) remain above the benchmark 50 level, says ISI, indicating expansion. One bright spot is the auto industry, our trusty indicator of the global economy’s fortitude (Read: Booming Global Auto Market Good for Many).
A supply shortage and slowdown in sales as a result of the Japanese earthquake caused many car manufacturers to initiate their annual plant shutdowns early this year. The shutdown time is used to perform maintenance on facilities and restock supply. Automakers such as Ford and General Motors have already completed their shutdowns and are “starting their engines” for a strong second half.
U.S. auto production is forecasted to be up 16 percent in July over the previous month and overall production during the third quarter of 2011 is expected to be up 86 percent on a quarter-over-quarter basis. ISI says this would likely raise America’s real GDP by 1 percent.
Who will buy all these cars? Chinese and Americans.
Despite the tightening measures mentioned above, Chinese citizens are expected to purchase 18.5 million vehicles this year, which would be about a 3 percent increase from 2010. ISI says owning a car remains the “#1 most desired consumer durable” in China and estimates the country could reach sales of 30 million per year by 2030.
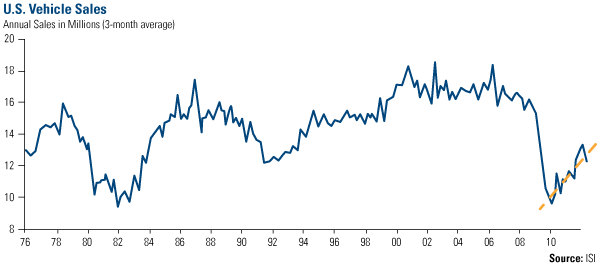
At home in the U.S., vehicles sales have been on an uptrend since early 2010. The chart shows current levels are still well below the highs of the mid-2000s but are comparable to the early 1990s—just about the time the U.S. economy was beginning to speed up.

The biggest question mark surrounding the direction of the market right now is geopolitical. How the debt ceiling issue is resolved and how companies digest new regulations could decide whether the bull market gets caged. J.P. Morgan-Chase CEO Jamie Dimon passionately told the Federal Reserve last month that some of the floated ideas could spell “suffocation through regulation” for the U.S. economy. Dimon questioned whether anyone had “bothered to study the cumulative effect” of all the new regulations. PIMCO co-CIO Bill Gross has echoed similar statements.
We share many of these concerns but feel the fundamentals of U.S. economic growth can power through these regulatory hurdles. Long-term investors must remember that it’s time in the market, not timing the market. The market may not soar into the stratosphere like Friday’s shuttle launch, but investors who catch the bull and participate could see gains over the next few months.
Portfolio manager and director of research John Derrick contributed to this piece.
The Dow Jones Industrial Average is a price-weighted average of 30 blue chip stocks that are generally leaders in their industry. The S&P 500 Stock Index is a widely recognized capitalization-weighted index of 500 common stock prices in U.S. companies. The Dow Jones Transportation Average (DJTA, also called the “Dow Jones Transports”) is a U.S. stock market index of the transportation sector, and is the most widely recognized gauge of the American transportation sector. It is the oldest stock index still in use, even older than its better-known relative, the Dow Jones Industrial Average (DJIA).
The Purchasing Manager’s Index is an indicator of the economic health of the manufacturing sector. The PMI index is based on five major indicators: new orders, inventory levels, production, supplier deliveries and the employment environment.
All opinions expressed and data provided are subject to change without notice. Some of these opinions may not be appropriate to every investor. The following securities mentioned in the article were held by one or more of U.S. Global Investors Fund as of March 31, 2011: J.P. Morgan-Chase.t