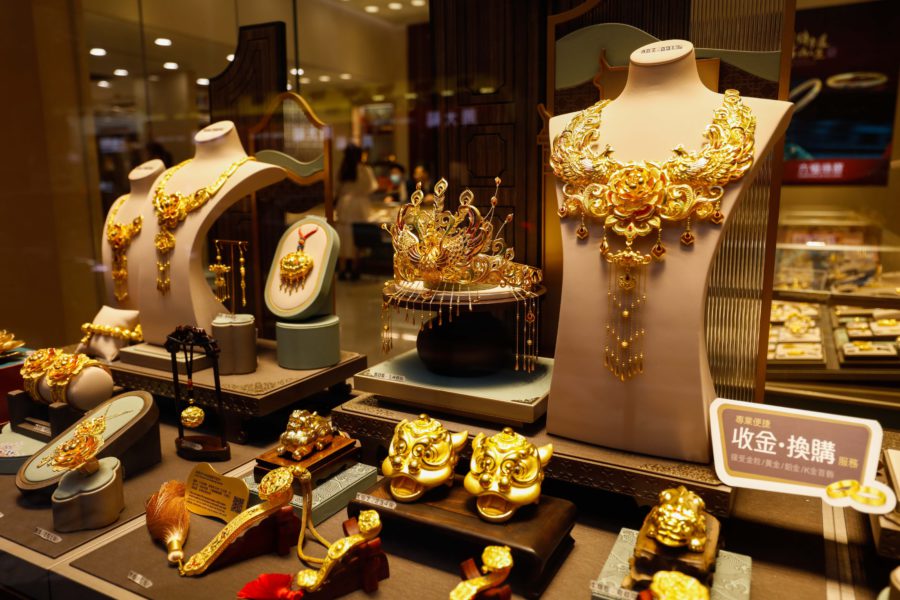
Update of Gold and Related Ratios

The daily chart of the Canadian dollar index is shown below, with the lower 55 MA Bollinger band falling beneath the lower 55 MA Bollinger band, suggestive that a bottom of some degree has been put in place. Full stochastics 1, 2 and 3 are shown below in order of descent, with the %K beneath the %D in all three instances. Given the sharp decline in the Canadian dollar the past few weeks, expect another 1-2 weeks of basing before any move up commences.

Figure 1

david-petch

The daily chart of the Australian dollar index is shown below, with the index falling beneath the lower 55 MA Bollinger band, suggestive that a bottom is in place of some degree. Upper Bollinger bands are all in close proximity to each other, suggestive that another 2-3 weeks of sideways price action is likely before the present consolidation is complete. Full stochastics 1, 2 and 3 are shown below in order of descent, with the %K beneath the %D in all three instances. Extrapolation of the %K in stochastics 1 and 2 suggest another 2-3 weeks of continued weakness.
Figure 2

david-petch-1

The daily chart of the Euro is shown below, with upper Bollinger bands rising…when they start to curl over, a bottom of some degree will be put in place. All three lower Bollinger bands are riding the index lower, suggestive that further downside potential exists. Full stochastics 1, 2 and 3 are shown below in order of descent, with the %K beneath the %D in 1 and 2 and above the %D in 3. Extrapolation of the %K trend suggests another 1-2 weeks of further downside before basing.

Figure 3

david-petch-2

US Dollar Index

The Daily chart of the USD index is shown below, with the upper 21 and 34 MA Bollinger bands riding the index higher. If the USD begins to peter out at this point, then a short term top will have been put in  place. The lower 21 and 34 MA Bollinger bands are starting to curl up (in close proximity to each other, suggestive that a short-term top is looming. Full stochastics 1, 2 and 3 are shown below in order of descent, with the %K above the %D in 1 and 2 and beneath the %D in 3. Extrapolation of the %K in stochastics 1 and 2 suggest another 1-2 weeks of potential upside. Once the %K in stochastic 1 falls beneath the %D, a top will have been put in place.

Figure 4

david-petch-4

The weekly chart of the USD index is shown below, with all three upper Bollinger bands starting to rise above the index, suggestive that further upside potential exists. The lower 55 MA Bollinger band is starting to curl down, suggestive the upward trend in the USD remains intact. Full stochastics 1, 2 and 3 are shown below in order of descent, with the %K above the %D in all three instances. Extrapolation of the %K in stochastics 2 and 3 suggest the USD could experience further upside for another 4-6 months.
Figure 5

david-petch-5

The monthly chart of the USD index is shown below, with lower Bollinger bands rising off the lows of the 68-70 range, confirming over six months ago that the 2008 lows would hold. Full stochastics 1, 2 and 3 are shown below in order of descent, with the %K beneath the %D in 1 and above the %D in 2 and 3. Notice the %K in stochastic 1 curling up and the %K in stochastic 3 is still rising strong. The monthly chart suggests the upward trend in the USD has at least 4-6 months of continued upside potential before topping out.

Figure 6

david-petch-6

The short-term Elliott Wave count of the USD index is shown below, with the thought patterns forming back in February still illustrated. The only way to accurately label this count is to have wave (2) as a running correction. If true, the USD top lies somewhere between 94-96. At present, wave 1.(3) is still in force, so expect a retracement of the upward move by at least 38.2-50%. At present, at top in wave 1 could be due in 2-4 days time.

Figure 7

david-petch-7

The mid-term Elliott Wave count of the USD index is shown below, with the thought pattern forming shown below in green. The count shown below has a large flat structure forming, with wave [C] currently underway. We have been following this pattern for the past 6-8 months and if the trend continues, expect the USD to continue a sharp advance over the course of the next 4-8 months. Once a top is put in place, the USD will be high relative to most currencies, which will affect exporting ability and throw the US back into a recession. Other countries will have to pay more for gold and oil, which will affect economic output. The cause of the next global recession is going to be currency based to start with, followed by further debt defaults and another run on the banks. As the Captain pointed out, expect the serial bailouts to continue, with the next major expenses to become the pension funds. The likely scenario for this will either be many companies going bankrupt to lower their pension obligations, or rules regarding pension contributions etc. To be rewritten. Don’t think this is possible, here in Manitoba, we had balanced budget legislation in place, but this year Manitoba had a 600 million dollar deficit. So what did our Provincial government do?…they removed the balanced budget legislation. Politicians will do whatever works for them, not the good of the people. Instead of allowing a little bit of pain and force a reduction in the number of government employees, the days of pain have been postponed for later on this decade.

Figure 8

david-petch-8

I will update the XOI tonight and  Horizon Beta funds tomorrow AM. Have a great day.
David Petch

May 12, 2010