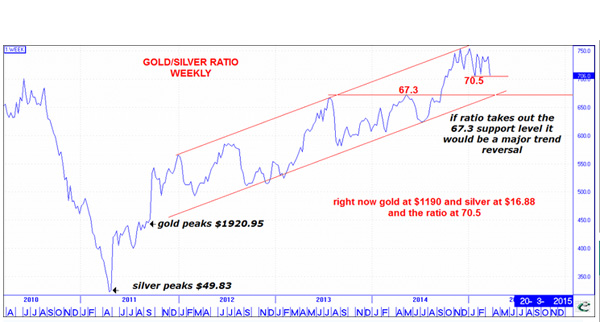
CHART: Gold-silver ratio nearing trend reversal
The gold price added to recent gains on Tuesday, finding support from a slump in the dollar following dovish comments from the US Federal Reserve and a diminishing likelihood of an early rate increase.
At $1,192.70 an ounce by late afternoon in New York gold investors can boast of a nearly 4% or more than $40 gain over the past week fortnight.
Silver bulls have enjoyed a more than 9% rise from its 2015 low of $15.37 hit on March 11. The closely watched gold-silver ratio on Tuesday was just over 70.
At around 70 the gold/silver price ratio remains close to levels last seen at the height of the global financial crisis versus long-term average of around 60.
InvesTRAC passed on this price graph to MINING.com indicating a bullish pattern emerging for the two precious metals.
The technical research and investment blog notes that when the ratio is rising then the precious metals decline and when the ratio is falling, both silver and gold usually go up. This is because silver usually leads gold up and down says InvesTRAC:
Now InvesTRAC’s medium term OB/OS indicator has started to fall, the weekly Direction Indicator is declining and the weekly price Forecaster shows an erratic trend until week ending April 17 then a sustained decline until the end of November. Let’s see what we can glean from the weekly chart below…the ratio needs to close below 70.5 weekly closing basis to open the way to decline to the uptrend at 67.3…if/when this level is violated it would result in a major trend reversal and signal a major bull trend in the precious metals was under way.
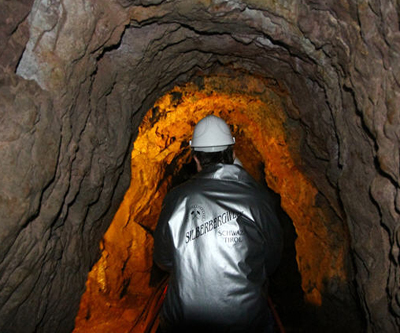
Schwaz, Austria: Tourists explore Silberbergwerk, the biggest silver mine of the middle ages Image by Sasimoto
More News

{{ commodity.name }}
{{ post.title }}
{{ post.date }}


Comments
Mr Grumpy
Looks good on paper but have you talked to JP Morgan and the lads on when they decide the price of precious metals moves north. Until JP and Scotia increase there long potions, nothing is going to happen.