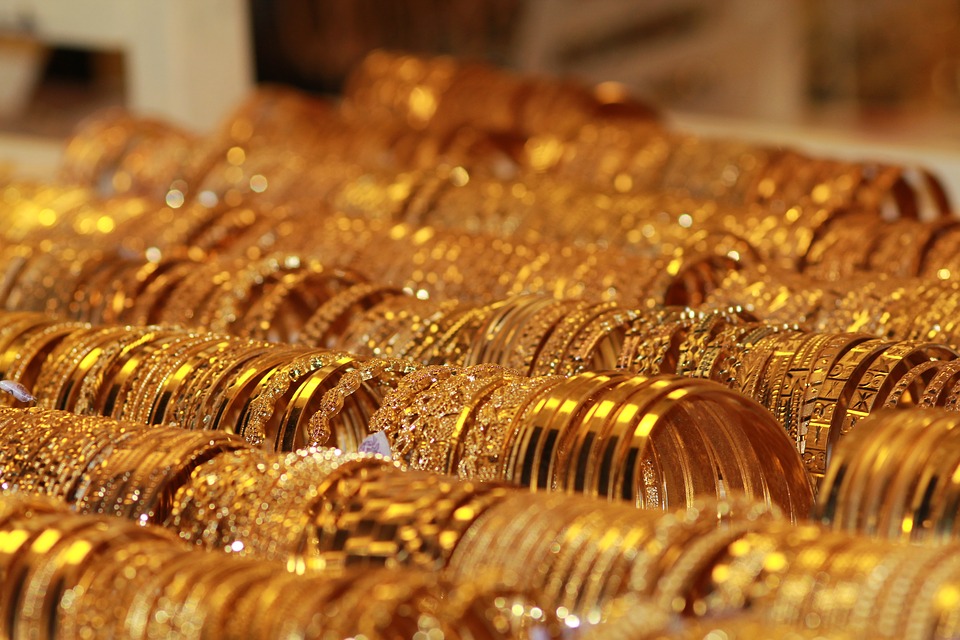
100-YEAR CHART: Gold price vs Dow Jones shows metal still cheap

100-YEAR CHART: Gold price vs Dow Jones shows metal still cheapOn Wednesday gold futures enjoyed another up day, lifting the price of the precious metal to a five-week high on the back of a huge selloff on equity markets after surprisingly weak economic data from the US.

In late afternoon trade on the Comex division of the New York Mercantile Exchange gold for December delivery was changing hands for $1,241.70 an ounce, up $7.40 from yesterday’s close.

Some safe haven buying prompted by wars in the Middle-East and a spreading Ebola pandemic also attracted buyers.

But it’s mainly falling bond yields (making gold which does not pay a coupon more attractive) and weakness on stock markets that have pushed the metal 4.2% higher in value from nine-month lows hit earlier in the month.

Despite the deep losses for US equities – the S&P500 is down nearly 8% since hitting a record high on September 18 – gold does not appear expensive relative to stocks.

This 100-year chart of the blue-chip Dow Jones Industrial index from Macrotrends tracks how many ounces of gold it would take to buy the Dow over any given month.

Previous cycle lows have been 1.9 ounces in February of 1933 and 1.3 ounces in January of 1980 when gold in inflation-adjusted terms hit an all-time high of roughly $2,400 an ounce.

When the nominal price of gold hit a record high above $1,900 in August 2011 the ratio was 6.4.

On Wednesday the Dow-Gold ratio was at 12.9 compared to highs around 40 between mid-1999 when gold reached lows of $250 an ounce and mid-2001.

Gold price hits 5-week high as stocks drop

The historic relationship between crude oil and the gold price also appears to have broken down.

The price of gold and the oil price usually rise in tandem because rising oil prices pushes up inflation and increase demand for gold as a hedge.

Since 1970 the average ratio – how many barrels of oil can be bought with one ounce of gold – is 15.

While gold looked grossly undervalued for most of the year with the ratio pegged at under 12, the relationship has now returned to historical norms as US crude plunges to multi-year lows in October.

While gold and the dollar usually moves in opposite directions gold recent strength has been into the teeth of a stronger dollar.

Gold’s gains may have been greater if not for the rising dollar as this trader explains.

Despite the strong bounce of the bottom, not everyone is back on board.

Both large investors and retail buyers have been using the rally as an opportunity to exit the market.

The third quarter was the sixth quarter in a row holdings in global exchange traded funds backed by physical gold were reduced and September was the worst month for ETF funds since December 2013.

The selling continued into October. Last week 16.2 tonnes flowed from gold-backed funds, dropping total holdings to 1,662.3 tonnes, following a 10 tonne reduction in the week to October 3.

Overall gold bullion holdings are now at five year lows and a whopping 970 tonnes below the record 2,632 tonnes or 93 million ounces reached in December 2012.

Comments