
Tiny but vital metal markets rush to adjust to Chinese clampdown
A bigger clampdown looks set to have far-reaching ramifications for supply chains feeding American defense and chip-making industries.
We were right. At the beginning of the year, in the January edition of the Gold Market Overview, we wrote that “2019 fundamental outlook for the gold market is better than one year ago”. The quote below will give you full insight into our predictions at that time:
As for the fundamental outlook, we believe that macroeconomic environment in 2019 could be more positive for the gold market than in 2018. To be clear, we do not expect a recession next year or even in 2020. However, a slowdown is possible, as the fiscal stimulus will dissipate, while the higher interest rates will exert their restrictive effect throughout the economy (we already see some problems in the housing market).
Hence, investors may switch into risk-off mode. The stock market correction with an usually long economic expansions create a conducive climate for such an approach. It goes without saying that gold could benefit, then.
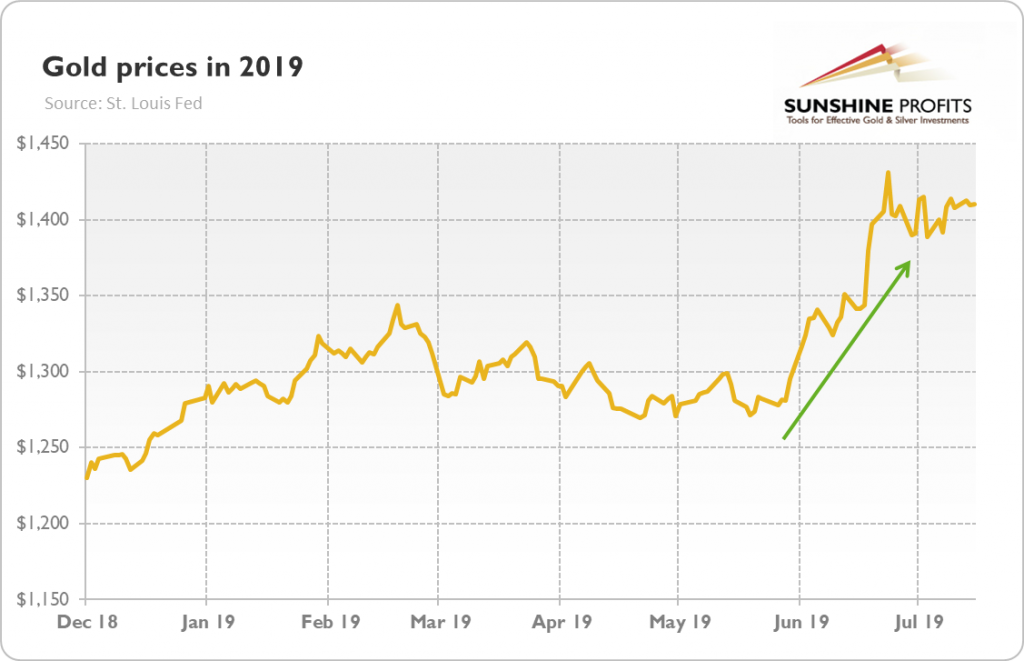
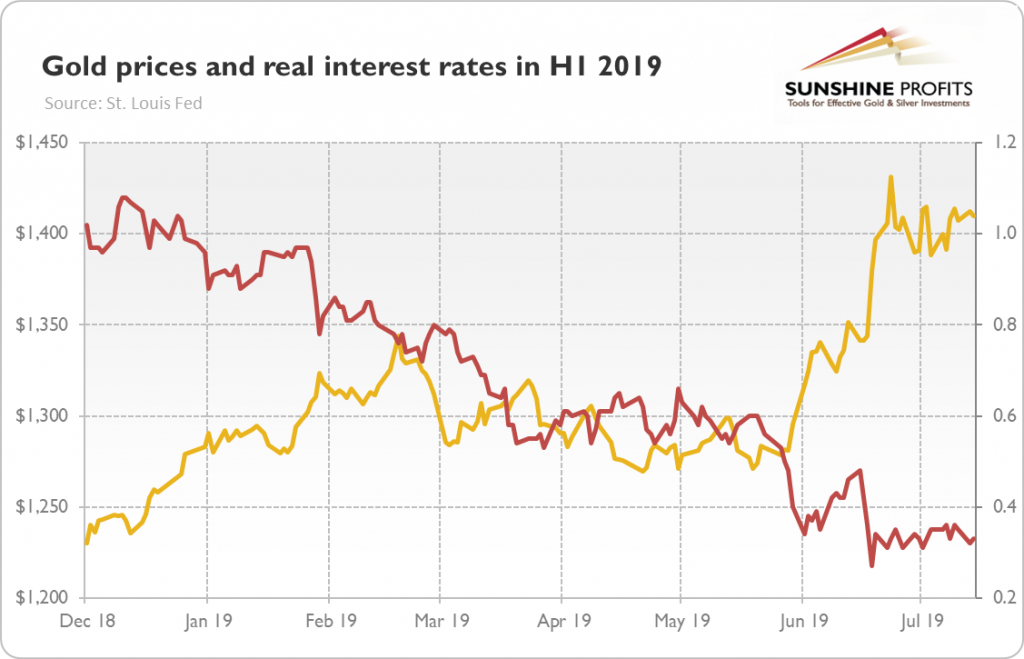
So far, so good! After the first half of the year, gold gained more than 10 percent, rising from $1,279 at the end of December 2018 to $1,409 at the end of June 2019, as one can see in the chart below.
What an improvement compared to the previous year! As the next chart shows, in H1 2018, the price of the yellow metal dropped about 3 percent, and about 1 percent during the whole year (which was, by the way, in line with our neutral to slightly bearish fundamental call for the previous year).
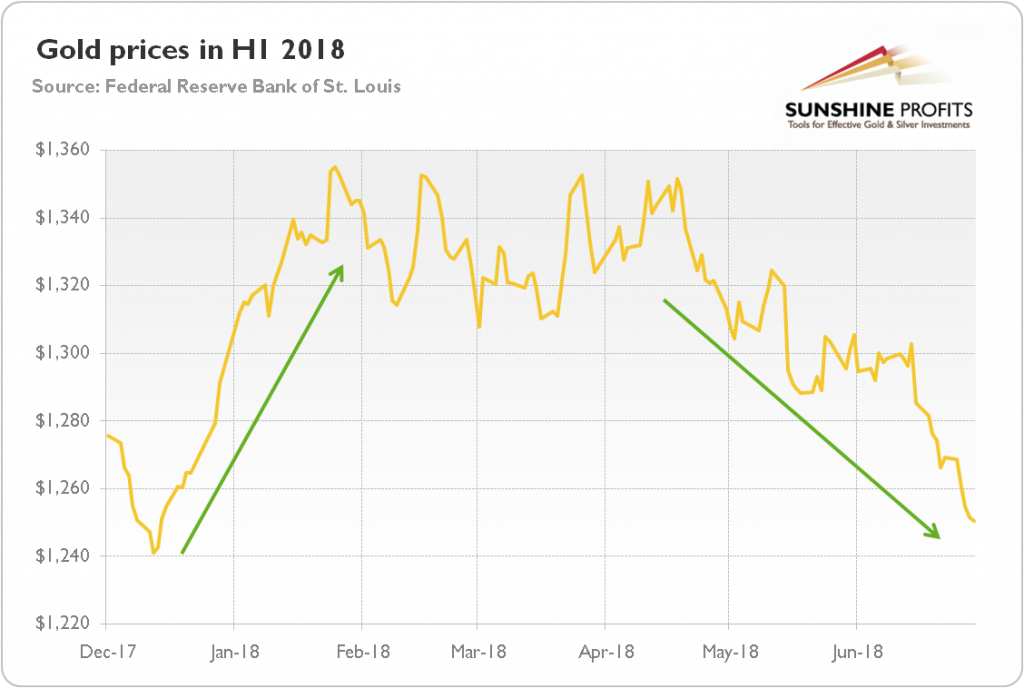
But the better performance is not the only remarkable thing gold did this year. Two more developments deserve Readers’ attention. First, in quite a few years lately, gold soared at the beginning of the year, only to run out of steam a few months later (the chart above shows this pattern for 2018). But in 2019, gold – although also started the year well – showed impressive resilience and actually accelerate in the second quarter of the year. Bravo, Mr. Precious!
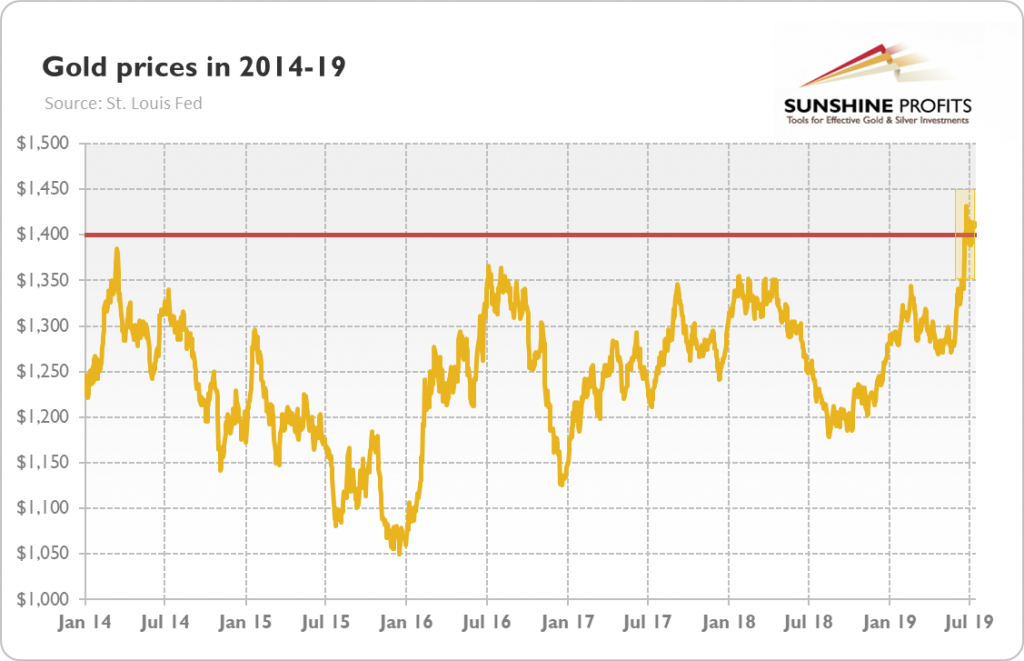
Second, the surprising gold’s strength in the second quarter of the year, in particular in June, enabled the yellow metal to escape its narrow trading range it was trapped in for the last few years and soared above the upper bound of $1,400 (it failed to break above it’s late-2013 high, though, so it remains in the consolidation). Let’s look at the chart below, which presents the gold’s jump in the historical context.
Of course, only time will tell whether gold’s great move above $1,400 will be sustainable or whether the bears will catch it in their claws and put it again in the sideways trend or even push it to new lows as quite a few technical indications suggest. From the fundamental point of view, there are fundamental reasons to believe that gold is able to defend its recent gains and run away from bears towards bulls.
After all, the yellow metal rallied for a reason. In the first half of the year, we have seen an important shift among the major central banks. The economic slowdown and collapsing inflation expectations pushed Draghi to repeat his “Whatever it Takes” speech in a mini version and the ECB to adopt a more dovish stance. Similarly, the members of the FOMC slashed their expectations of the appropriate path of the federal funds rate (see our Gold News Monitor for more on that), while Powell softened substantially his tone, preparing the markets for an interest rate cut in July.
This Fed’s U-turn pushed the bond yields lower, which helped the yellow metal. As the chart below shows, the long-term real interest rates have almost halved, declining from around 0.60 percent in May to slightly above 0.30 percent in June. Low bond yields are supportive for the gold prices. By the way, if you have not heard yet, the world now has $13 trillion of debt with below-zero yields. Welcome to the brave new world.
What is important here is that the Fed’s decision is not one-night stand, but rather a flirtation with more accommodative monetary policy. The tightening cycle is behind us. Remember the new macroeconomic context: muted inflation, slower global economic growth and the inverted yield curve. Recessionary fears are rising. So, the Fed decided to deliver an “insurance cut”. If you lower interest rates “just in case”, you are not likely to raise them anytime soon. Perhaps global economy is simply too indebted to live with slightly more normalized interest rates. Anyhow, gold should shine as we will see an even looser monetary policy and even lower bond yields.
(By Arkadiusz Sieron)


Comments