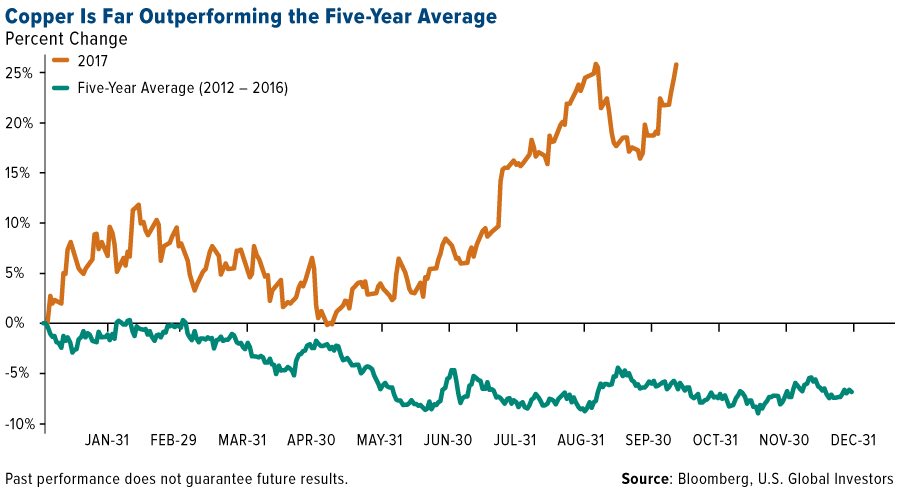
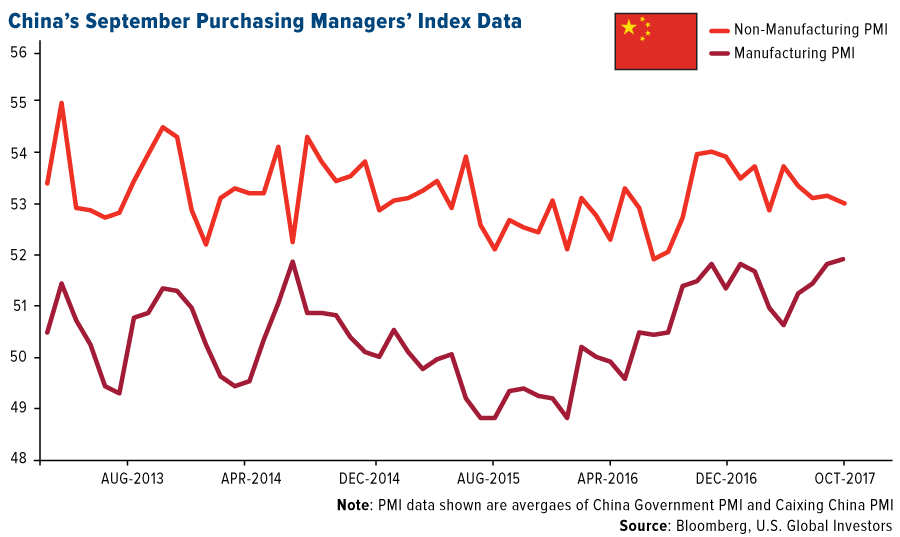
Several factors are driving the price of the red metal right now. Manufacturing activity, as measured by the purchasing manager’s index (PMI), is expanding at a pace we haven’t seen in years in the U.S., eurozone and China. The U.S. expanded for the 100th straight month in September, climbing to a 13-year high of 60.8.
Speculators are also buying in response to word of copper shortages in China, despite September imports of the metal rising to its highest level since March. The world’s second-largest economy took in 1.47 million metric tons of copper ore and concentrates last month, an amount that’s 6 percent higher than the same month in 2016.
Why Copper Is the “Metal of the Future”
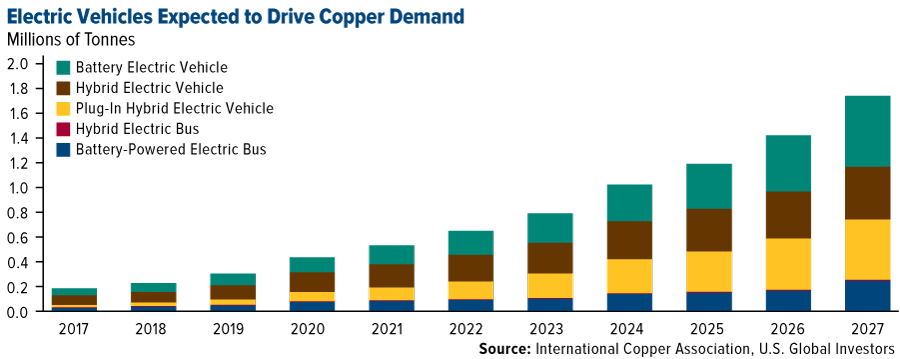
Why are we seeing so much copper entering China? One reason could be battery electric vehicles (BEVs), which require three to four times as much copper as traditional fossil fuel-powered vehicles.
China is already the world’s largest and most profitable market for BEVs, and Beijing is now reportedly working on plans to curb and eventually ban the sale of fossil fuel-powered vehicles, according to the Financial Times. This would place the Asian giant in league with a number of other powerful countries similarly crafting bans on internal combustion engines within the next 25 years, including Germany, France, Norway, the United Kingdom and India.
Because of the sheer size of the Chinese market, this move is sure to delight copper bulls and investors in any metal that’s set to benefit from higher BEV production. That includes cobalt, lithium and nickel.
According to Bloomberg New Energy Finance, BEVs will account for 54 percent of all new car sales by 2040. That year, China, Europe and the U.S. are expected to make up 60 percent of the global BEV fleet.
This could have a huge effect on copper prices over the next 10 years and more. With fewer and fewer large deposits being discovered, demand should accelerate from 185,000 metric tons today to an estimated 1.74 million tonnes in 2027, according to the International Copper Association.
These are among the reasons why Arnoud Balhuizen, chief commercial officer of Australian mining giant BHP Billiton, called copper “the metal of the future” in an interview with Reuters last month.
“2017 is the revolution year [for electric vehicles], and copper is the metal of the future,” Balhuizen said, adding that the market is grossly underestimating the red metal’s potential as BEV adoption surges around the world.
Cobalt Gets Its Day in the Sun
And let’s not forget cobalt. The brittle, silver-gray metal, used to extend the life expectancy of rechargeable batteries, is up more than 81 percent so far in 2017 and 109 percent for the 12-month period. Performance is being driven not only by growing BEV demand but also supply disruptions in the Republic of the Congo, where more than 60 percent of the world’s cobalt is mined.
“It’s a really bright future for cobalt,” Vivienne Lloyd, analyst at Macquarie Research, told the Financial Times. “There doesn’t seem to be enough of it.”
Before now, there was very little mainstream interest in cobalt as an investment, but that’s changing as rapidly as world governments are joining the chorus to move away from fossil fuels. One sign of that change is the London Metal Exchange’s (LME) upcoming cobalt contracts, one for the physical metal and another for the chemical compound cobalt sulphate. This will allow investors to trade the underlying metal and participate in the electric vehicle “revolution,” as Balhuizen calls it.
In the meantime, investors can participate by investing in a producer with exposure to cobalt—among our favorites are Glencore, Freeport-McMoRan and Norilsk Nickel—or a natural resources fund.
Gold Closes Above $1,300 an Ounce
Gold also looks constructive as we head into the fourth quarter and beyond, according to a number of new reports and analysis this week.
UBS strategist Joni Teves finds it “encouraging” that gold has managed to recover this year off its 2016 lows. Although a likely December rate hike could be a headwind, Teves points out that the metal performed well in the months that followed the previous three rate hikes. What’s more, gold has rallied in each January since 2014. We could see a similar bump in price this coming January.
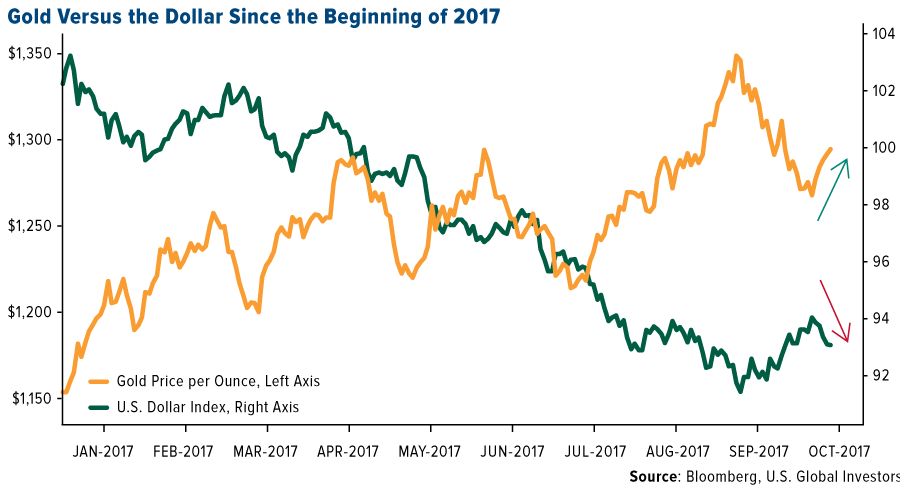
Not only is gold trading above its 50-day moving average again, but for all of 2017, it’s been following a nice upward trend as the U.S. dollar dips further.
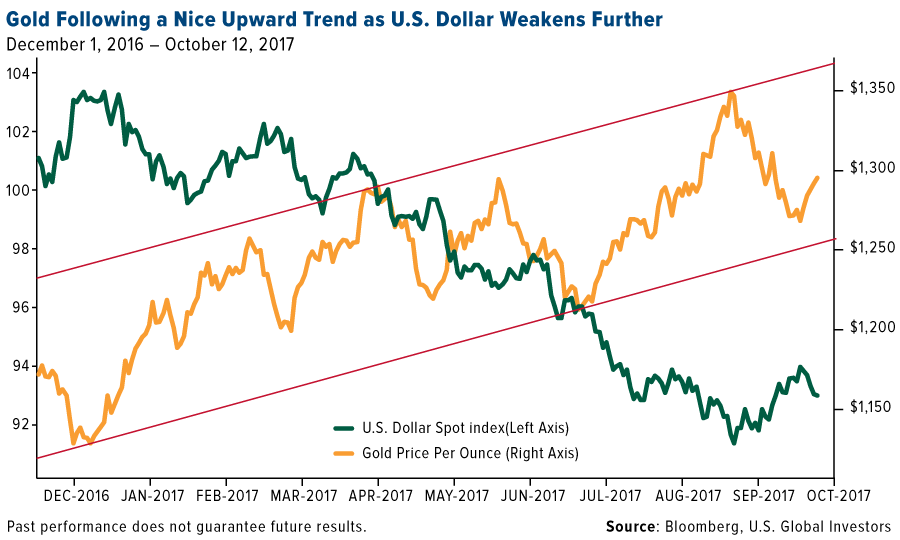
A weaker greenback, of course, is bullish for all commodities, including copper. According to Bloomberg strategist Mike McGlone, unless the dollar unexpectedly recovers in the near term, commodities, as measured by the Bloomberg Commodities Index, could gain as much as 20 percent between now and year’s end.
Meanwhile, BCA writes that major risks in 2018—inflationary expectations stemming from President Donald Trump’s protectionism, tensions between the U.S. and China, and continued strife in the Middle East among them—could keep the shine on gold.
The research firm reminds investors that gold has historically done well in times of economic and geopolitical crisis, outperforming the S&P 500 Index, U.S. dollar and 10-year Treasury by wide margins. Because the metal is negatively correlated to other assets, it could potentially serve as a good store of value if equities entered a bear market.
Such a bear market, triggered by tighter U.S. monetary policy, could take place as early as 2019, BCA analysts estimate. Gold would then stand out as a favorable asset to hold, especially if inflationary pressures pushed real Treasury yields into negative territory.
A Fear Trade Lesson from Germany
This is the lesson Germany has learned over the past 10 years, as I shared with you this week. Before 2008, Germans’ investment in physical gold barely registered on anyone’s radar, with average annual demand at 17 metrics tons. The country’s first gold-backed exchange-trade commodities (ETCs) didn’t even appear on the market until 2007.
But then the financial crisis struck, followed by monetary easing and low to negative interest rates. These events ultimately pushed many Germans into seeking a more reliable store of value.
Now, a new report from the World Gold Council (WGC) shows that German investors became the world’s top gold buyers in 2016, ploughing as much as $8 billion into gold coins, bars and ETCs. Amazingly, they outspent Indian, Chinese and U.S. investors.
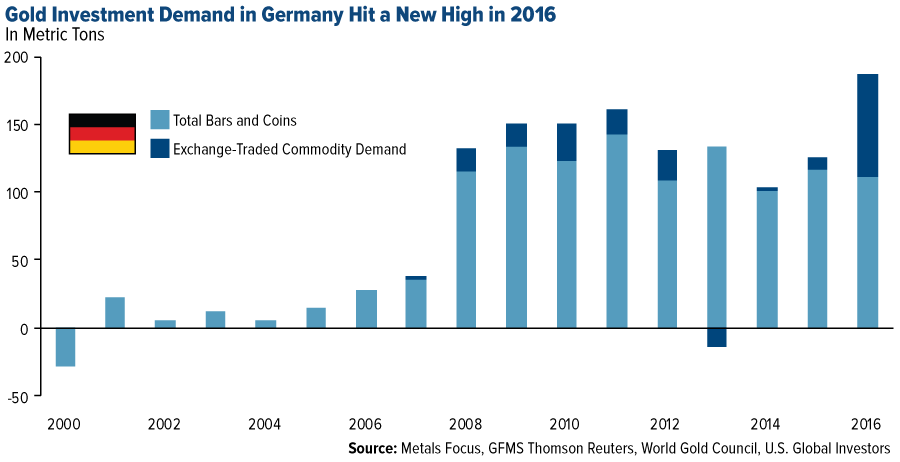
Analysts with the WGC believe there is room for further growth, citing a recent survey that shows latent demand in Germany holding strong. Impressively, 59 percent of German investors agreed that “gold will never lose its value in the long-term.” That’s a huge number, suggesting the investment case for gold remains attractive.
Index Summary
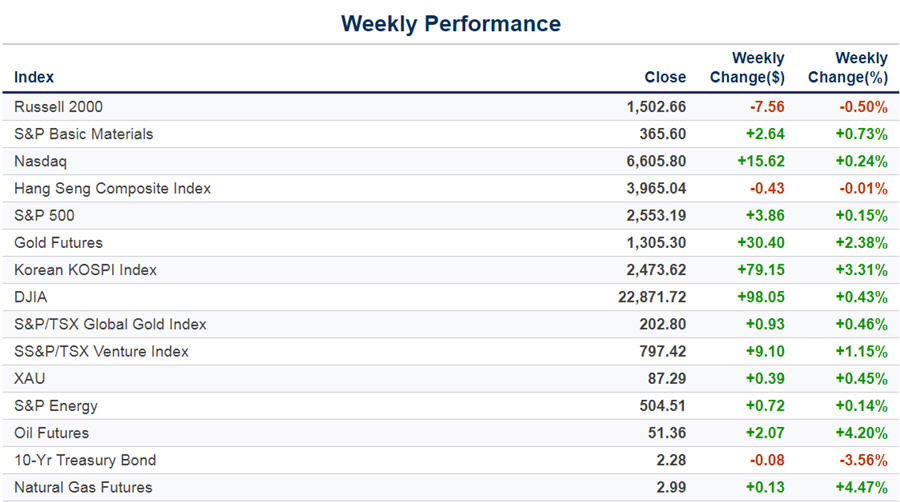
- The major market indices finished mixed this week. The Dow Jones Industrial Average gained 0.43 percent. The S&P 500 Stock Index rose 0.15 percent, while the Nasdaq Composite climbed 0.24 percent. The Russell 2000 small capitalization index fell 0.50 percent this week.
- The Hang Seng Composite gained 0.06 percent this week; while Taiwan was up 1.82 percent and the KOSPI rose 3.31 percent.
- The 10-year Treasury bond yield rose 8 basis points this week to 2.28 percent.
Domestic Equity Market
Strengths
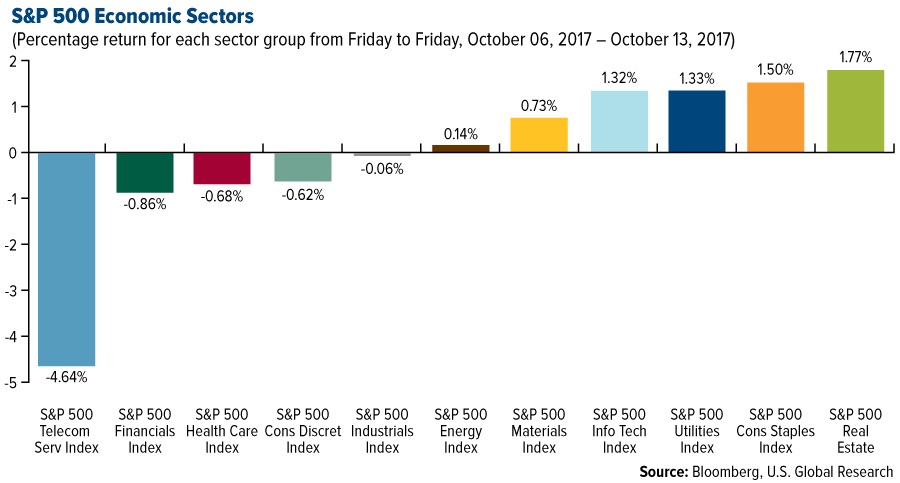
- Real estate was the best performing sector of the week, increasing by 1.77 percent versus an overall increase of 0.15 percent for the S&P 500.
- Walmart was the best performing stock for the week, increasing 9.65 percent.
- Snap hit a three-month high as shares rallied 3.35 percent to $16.51 on Thursday, making for its best close since July 10.
Weaknesses
- Telecommunications was the worst performing sector for the week, falling 4.64 percent versus an overall increase of 0.15 percent for the S&P 500.
- PG&E was the worst performing stock for the week, falling 16.15 percent.
- Samsung Electronics’ CEO has resigned due to “unprecedented crisis,” the BBC reported. In August, the heir to the group was jailed for corruption.
Opportunities
- The Trump administration revealed how it wants to make going public easier for companies. The U.S. Treasury department published a report Friday outlining its plan for financial deregulation. The plan would loosen restrictions on the initial-public-offering process and generally lessen the burden on smaller corporations.
- Bank of America Merrill Lynch highlighted a weak U.S. dollar as boosting the profitability of multinational corporations. An index tracking the U.S. dollar versus other currencies has fallen 8.3 percent in 2017.
- Morgan Stanley published a note forecasting the S&P 500 to climb to 2,700 by the end of first quarter 2018, the most bullish target on Wall Street.
Threats
- A gauge of stock market conditions just flashed a red flag. The measure in question is the relative strength indicator (RSI), which indicates when the stock market has gotten too stretched in either direction. An RSI measure exceeding 70 means the market is overbought. A drop below 30 indicates an oversold condition. The RSI for the benchmark S&P 500 climbed above 70 last week and stayed in that overvalued territory for five straight days. The index’s repeated climb to record highs is now in danger based on recent history. The indicator also climbed above 70 late last year, peaking on December 13. The S&P 500 was almost unchanged over the next month, pausing the momentum that had seen the benchmark surge in 2016. More recently, in early March, the RSI on the index once again peaked above 70. The S&P 500 dropped 1.4 percent over the next month, despite a 5.6 percent year-to-date climb through the end of February.
- While Goldman Sachs sees tax reform propping up the S&P 500 during this reporting period, its 2017 forecast calls for the S&P 500 to fall roughly 6 percent to 2,400. Meanwhile, Bank of America Merrill Lynch sees a more measured drop to 2,450 by the end of 2017.
- A calm and steadily climbing stock market is worrying Richard H. Thaler, the University of Chicago professor who this week won the Nobel Prize in economics. “We seem to be living in the riskiest moment of our lives, and yet the stock market seems to be napping,” he said.
The Economy and Bond Market
Strengths
- The University of Michigan Consumer Sentiment Index showed U.S. consumer sentiment unexpectedly surged to a 13-year high as Americans’ perceptions of the economy and their own finances rebounded following several major hurricanes. The sentiment index rose to 101.1, the highest since January 2004, from 95.1 in September. It beat expectations of 95.
- Retail sales in the U.S. rose 1.6 percent in September, the largest increase in two-and-a-half years. The boost came mainly from new automobiles and trucks, reflecting the purchase of replacement vehicles after many were damaged by hurricane-related flooding in Texas and Florida. Home-supply stores also got a boost in the cleanup that followed the storms. Further, higher gasoline prices lifted sales at gas station dealers as well.
- Bonds rose and the dollar nudged higher as investor focus switched back to central banks after the release of last month’s Federal Reserve meeting minutes.
Weaknesses
- The U.S. Consumer Price Index rose 0.5 percent in September, after increasing 0.4 percent in August, the U.S. Labor Department said. However, this was weaker than expected as consensus forecasts called for a rise of 0.6 percent.
- The National Federation of Independent Business’s index of small business optimism fell to 103 in September, down from 105.3 in August. Expectations were that it would decline slightly to 105.
- Moody’s said capital investments have declined steadily, as a share of the economy, to 1.7 percent of GDP by the second quarter. In 2009, they accounted for 2.6 percent of GDP. “State and local governments, facing pressure to spend more on pensions, public education and other priorities apparently more pressing than infrastructure, have been curtailing investment in a broad range of capital assets,” wrote analyst Dan Seymour.
Opportunities
- The IMF lifted its 2017 and 2018 forecasts. Global GDP will expand 3.6 percent this year and 3.7 percent next, up 0.1 percent from its prior estimates. The outlook for the U.S., euro area, Japan and China has also improved.
- Federal Reserve rate-hike odds continue to increase with the market pricing in a 76.7 percent chance that the Fed hikes interest rates this year, up from about 20 percent two months ago, according to Bloomberg data.
- The Communist Party’s National Congress of China will begin on October 18. Investors will be looking for clues on the direction of economic policies in the second half of President Xi Jinping’s term.
Threats
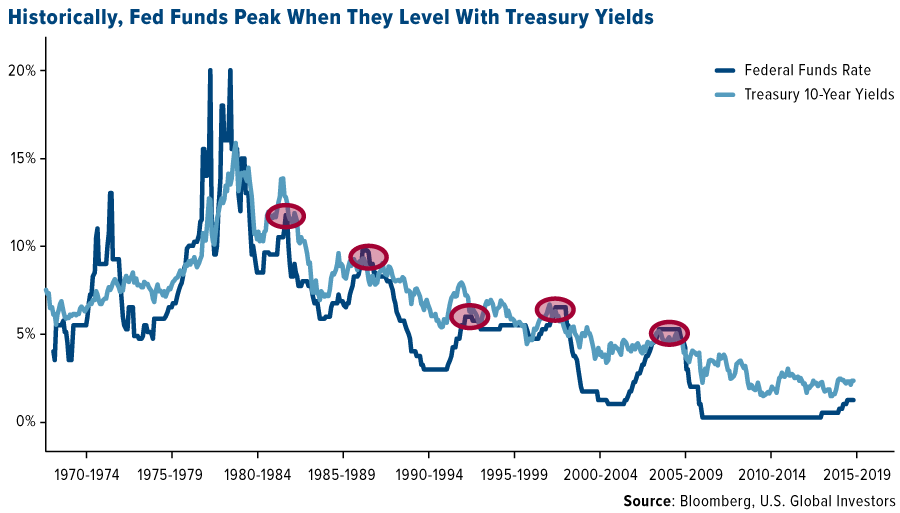
- Based on past cycles, traders could be underestimating the number of interest-rate increases that the Federal Reserve may pull off. Historically, policy makers only stopped raising the federal funds rate when it leveled with 10-year Treasury yields. The note currently yields around 2.35 percent, compared with the upper bound of the fed funds target range of 1.25 percent. Also, as of Thursday, rate traders saw less than a 10 percent probability of the top end of the central bank’s policy rate reaching 2.25 percent by the end of 2018. This suggests bonds may not be pricing in that level of interest rates.
- Minutes from the September Federal Open Market Committee meeting released Wednesday show that many members of the committee believe inflation will remain below the Federal Reserve’s 2 percent target for longer.
- Rising debt could trigger the next financial crisis, Germany’s finance minister warned. Speaking with the Financial Times, Wolfgang Schaeuble warned that spiraling levels of debt, as well as the growth of liquidity across the world, risked creating a new financial crisis.
Gold Market
This week spot gold closed at $1,303.28, up $26.68 per ounce, or 2.09 percent. Gold stocks, as measured by the NYSE Arca Gold Miners Index, ended the week higher by 1.40 percent. Junior-tiered stocks underperformed seniors for the week, as the S&P/TSX Venture Index came in up 1.15 percent. The U.S. Trade-Weighted Dollar reversed course this week and fell 0.79 percent.
Strengths
- The best performing precious metal for the week was palladium, up 7.28 percent as money managers raised their net-long positions on continued expectations that the shift from diesel to gasoline powered cars will continue.
- Gold traders and analysts surveyed by Bloomberg are bullish for the first time in five weeks, reports Bloomberg. Following the release of the Fed minutes which showed rising concern about low inflation, the yellow metal climbed to a two-week high. A fresh flare-up in tensions with North Korea pushed gold higher this week, writes Bloomberg, along with a U.S.-Turkey diplomatic spat regarding visitor visas was supportive.
- The Indian government withdrew an order that brought the gold industry under anti money-laundering legislation, reports Bloomberg. Jewelers were included in the Prevention of Money-Laundering Act in August that increased compliance requirements. In response to the rule reversal, shares of jewelers climbed in the country. This move comes just as gold buying improves before the Hindu festival of Diwali, the peak season for demand, the article continues.
Weaknesses
- The worst performing precious metal for the week surprisingly was gold, up more than 2 percent, despite grabbing most of the precious metals headlines.
- According to the People’s Bank of China website, gold reserves in China came in at 59.24m fine troy ounces in September, unchanged again from the previous month, which unfortunately is beginning to become a trend. Chinese markets had been closed the prior week to mark National Day.
- Oddly, the B2Gold share price underperformed for the week as it reported a production beat for the third quarter as well as its first gold pour at Fekola. SSR Mining also reported a minor shortfall in quarterly production which did hit the share price as well.
Opportunities
- The odds of an interest rate increase by year-end fell to 73 percent on Friday, from 77 percent on Thursday, weakening the dollar, according to fed funds futures data compiled by Bloomberg. Gold climbed above $1,300 on the dovish news and this has heads turning somewhat back to gold versus the bulk miners as the following report illustrates. S&P Global Market Intelligence released a note this week showing that miners planned to spend nearly $8 billion looking for new deposits in 2017, about 14 percent more than last year, reports Bloomberg. Gold exploration budgets in particular rose 22 percent to $4.1 billion in 2017, the article continues. That’s the biggest increase among nonferrous metals.
- Another report this week comes from UBS, saying that gold is poised for a recovery. “Following the past three Fed rate hikes, gold typically performed well in the months that followed, while the dollar, rates and equities tended to come off. Gold has rallied each January since 2014 and we think there is reasonable potential for this trend to continue,” the report reads.
- Miners could be spared a proposed royalty increase in Western Australia, reports Bloomberg, after the government’s opposition party said it would block the motion in parliament. Western Australia hosts four of the nation’s biggest gold mines. Leader of the opposition Liberal party Mike Nahan said on Tuesday that Liberal party members of parliament will vote with other minor and cross-benchers to overturn the royalty increase.
Threats
- Despite gold surpassing $1,300 this week, Goldman Sachs sees further technical weakness for the yellow metal, with the potential for prices to fall 14 percent from current levels, reports Bloomberg. The bank has been fairly bearish on gold, maintaining its outlook in a September report that gold prices will end the year at $1,250 an ounce.
- Foreign Relations Committee Chairman Bob Corker and President Donald Trump ratcheted up a feud this week over Twitter. Corker called the White House an “adult day care center” and warned that Trump could set the U.S. “on the path to World War III,” reports Bloomberg.
- Following reports that Secretary of State Rex Tillerson called President Donald Trump a moron, the president fired back defending his intelligence, reports Bloomberg. “I think it’s fake news, but if he did that, I guess we’ll have to compare IQ tests,” Trump said in a Forbes interview. “And I can tell you who is going to win.”
Energy and Natural Resources Market
Strengths
- Natural gas was the best performing commodity this week, rising 4.47 percent. The commodity rallied the most in three weeks after government data showed inventories rose less than expected. The data followed two straight reports of unusually small stockpile increases, suggesting the current inventory may be insufficient to fully supply the winter season. In addition, U.S. forecasters boosted the odds of La Nina, a weather pattern that can bring frigid conditions to the northern tier of the country.
- The best performing sector this week was the S&P 500 Integrated Oil & Gas Index. The index of major U.S.-domiciled integrated oil names rallied as WTI oil prices climbed to reclaim the $50 per barrel level.
- CVR Refining LP, a limited partnership with refining and logistics assets, was the best performing stock this week finishing up 11.27 percent. The stock rallied after Tudor Pickering recommended investors buy the stock after the company began to unwind its short position in “RINs.” The stock has since surpassed key technical resistance levels, and analysts have suggested the stock may be poised for a rally.
Weaknesses
- Iron ore was the worst performing commodity this week, up only 47 basis points. The commodity is close to setting records for low performance after a spectacular run earlier in the year. A major environmental policy enforcement by Chinese authorities resulted in numerous steel mills forced to shut down, which has resulted in weaker-than-expected demand for the steel-making raw material.
- The worst performing sector this week was the S&P 1500 Oil & Gas Equipment and Services Index. The index dropped 1.75 percent for the week after analysts at BMO downgraded their outlook on heavy-index component Schlumberger. The report suggested the company is trading well above its long-term EBITDA multiple, while its revenue growth is coming from some of its lower margin segments, implying that the higher multiple may prove unsustainable.
- The worst performing stock for the week was K+S AG. The German producer of fertilizers dropped 7.82 percent. K+S announced plans to combine its salt and potash businesses to lower costs, disappointing investors hoping for a more far-reaching overhaul. The company also delayed its cash flow goals for an additional year, from 2018 to 2019.
Opportunities
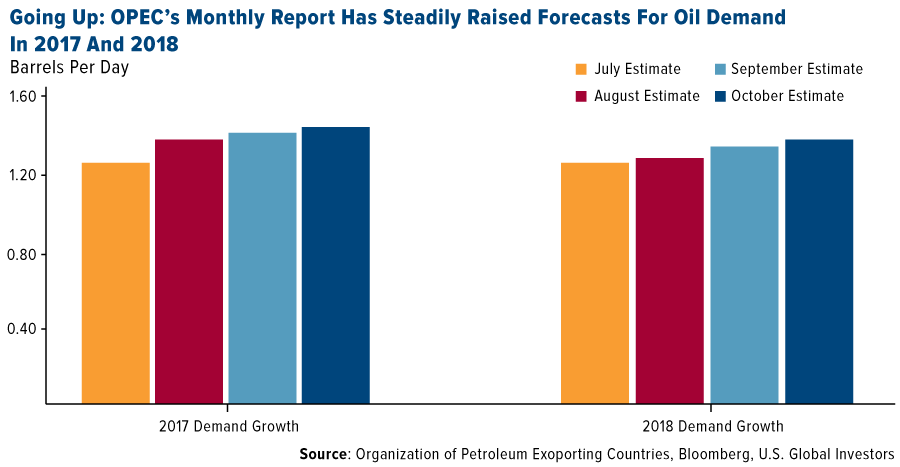
- The ongoing global economy strength will drive higher demand for crude according to OPEC. The Organization of Petroleum Exporting Countries boosted oil-demand estimates for this year and next year amid a strengthening global economy, quotes Bloomberg. OPEC will need to pump an additional 350,000 barrels of oil per day to meet demand for the remainder of 2017, according to its own internal estimates. The positive adjustment to supply-demand expectations could support crude prices above $50 per barrel for the remainder of the year.
- Gold prices may rally as rate hike expectations are set to drop on Fed minutes. With the market pricing in a near certain rate hike in December, some may be disappointed if the warnings in the recent Fed minutes last until December. The Fed stated that most of its voting members “did not assume the impact of fiscal stimulus in their forecasts, or they downgraded any impact.” The statement clearly suggests the Fed believes there is considerable downside to the economy in case of a failure to pass Trump’s proposed tax plan; which based on the voting members’ opinion is not advanced enough to believe its impact should be included in their economic forecasts.
- Europe’s engine continues to hum louder in 2017. Eurozone industrial production continued to beat expectations, rising 1.4 percent for August and validating the earlier PMI readings. Eurostat has revealed that large increases in output from Germany, Italy and Spain have driven a strong beat to overall bloc industrial production. The strong reading bodes well for business investment demand and translates into healthy demand for raw materials and commodities.
Threats
- OPEC’s Secretary General Mohammed Barkindo called on U.S. shale producers to help curtail global oil supply. Barkindo suggested it may be necessary to apply extraordinary measures next year to sustain the rebalanced market as supply growth is once again set to outpace demand growth. With U.S. shale having demonstrated its ability to continue to lower operating costs at a much quicker rate than other major oil basins, it is highly unlikely that producers in the region would voluntarily curtail supply if market prices remain at or around the $50 per barrel level.
- China’s real estate curbs are softening the domestic housing market as evidenced by recent data showing property sales in major cities dropped to a three-year low. Beijing, Shanghai and Guangzhou all saw plummeting property sales over the recent National Day Holiday period, suggesting that the more than 150 policies to curb the housing market are beginning to deliver the desired effect. A slowdown in the Chinese property sector has major negative consequences for the base and industrial metals markets which are heavily used as inputs into property construction and development.
- Iron ore futures in China are set for a record run of losses as environmental and property curbs harm demand for the steel-making raw material. The enforcement of strict environmental regulations has led to the early closure of numerous steel mills, reducing the overall demand for iron ore. However, when investors believed other mills would pick up slack and operate at higher rates, the demand for steel itself has begun to drop dramatically as property curbs to stamp out real estate speculation have led to major drops in property sales across major housing markets in China.
China Region
Strengths
- Korea’s KOSPI Index closed up 3.31 percent this week, surging after a six day hiatus in trading for holiday closures.
- China’s foreign reserves came in at $3.109 trillion, ahead of analysts’ estimates for a $3.100 print and up from August’s $3.092 trillion. China’s year-over-year imports also rose, up 18.7 percent and ahead of analysts’ expectations for a gain of only 14.7 percent. FDI in China rose, too, climbing to 17.3 percent year-over-year and up from last month’s 9.1 percent print.
- Taiwan’s exports jumped 28.1 percent for the year—the most since 2010, according to Bloomberg data—far surpassing analysts’ expectations for a 13.6 percent increase. Imports also rose, climbing 22.2 percent year-over-year, similarly surpassing expectations, in this case for a 9.8 percent rise.
Weaknesses
- Malaysia’s FTSE Bursa Malaysia Kuala Lumpur Composite Index declined mildly for the week, losing 29 basis points during that time.
- The September reading of the Caixin China Services PMI came in at 50.6, falling from August’s 52.7 print, though remaining in expansionary territory above the 50.0 line. The composite for the Caixin China PMI thus came in at 51.4, below last month’s 52.4 reading.
- Year-over-year domestic vehicle sales in Vietnam fell in the September period by 20.2 percent.
Opportunities
- After receiving approval from the central bank on Monday, China launched a payment versus payment system (PVP) for Chinese yuan and Russian ruble transactions, reports Reuters. The move was made to reduce risks and improve the efficiency of its foreign exchange transactions.
- Next week’s Communist Party Congress in China is expected to stress stability, reports Reuters. On Friday, China stocks inched up in quiet trading as investors anticipate markets to remain stable ahead of the meeting, the article continues.
- China’s top coal-producing region, the Shanxi province, has pledged to cut the concentration of hazardous airborne particles (known as PM2.5) by 40 percent over the winter months, reports Reuters. The official Xinhua news agency says that the province will also aim to cut concentrations of sulphur dioxide, a key component of smog, by 40 percent over the October – March period.
Threats
- China’s trade surplus with the U.S. came in at the highest on record, reports Reuters. September’s surplus rose to $28.08 billion versus $26.23 billion last month, according to Chinese customs data. “That could give fresh ammunition to U.S. President Donald Trump, who has long complained that the trade imbalance between the two nations hurts the U.S. economy,” the article reads.
- Ford Motor Co. is feeling the impact of global rivals in the Chinese automobile market, as the company’s vehicle sales increased just minimally in September in the Asian nation. Ford has “lacked a high-volume brand of affordable entry cars for China and has been criticized for slow decision-making that has cost it share in a market where consumer tastes change quickly,” writes Reuters.
- Though press reports this week quote White House Chief of Staff John Kelly as saying that North Korea is now considered “manageable,” he quipped that Americans should nonetheless “be concerned” about the state of the situation and the rapidly developing ICBM “capability” of North Korea.
Emerging Europe
Strengths
- Hungary was the best performing country this week, gaining 2.51 percent. Hungary’s industrial production growth accelerated in August, in line with the flash data. The volume of industrial production climbed to 6.8 percent year-over-year, much faster than the 0.2 percent rise in July.
- The Polish zloty was the best relative performing currency this week, gaining 2.26 percent against the U.S. dollar. September inflation increased to 2.2 percent from 1.8 percent in August, but still remains below the central bank’s target. More analysts now expect the central bank to start hiking rates in the first half of next year.
- Utilities was the best performing sector among eastern European markets this week.
Weaknesses
- The Czech Republic was the worst performing country this week, losing 47 basis points. Two weeks before legislative elections, Andrej Babis, the leader of ANO – the most popular political party, was charged with the misuse of EU funds. Last month, parliament stripped him of the immunity that protects lawmakers from prosecution. Babis denies any wrong doing, and called the move “politically motivated.”
- The Turkish lira was the worst performing currency this week, losing 46 basis points against the U.S. dollar. The lira has been under pressure as political tension between Turkey and the Unites States increase. Last week, Turkish authorities detained a U.S. consulate employee in Istanbul for alleged links to Fethullah Gulen, a U.S.-based Muslim leader blamed by Turkey for a failed coup attempt last year. Over the weekend, Turkey and the U.S. mutually suspended visa services.
- Real estate was the worst performing sector among eastern European markets this week.
Opportunities
- The International Monetary Fund raised its estimate for global economic growth in 2017 and next year, citing stronger expansion in the first half of the year in the eurozone, Japan and some emerging markets. Globally, the IMF upped its growth forecast to 3.6 percent in 2017 and 3.7 percent in 2018. “Broad-based upward revisions in the euro area, Japan, emerging Asia, emerging Europe, and Russia — where growth outcomes in the first half of 2017 were better than expected — more than offset downward revisions for the United States and the United Kingdom,” the IMF said.
- Wood &Company in its latest research publication on Greece, says that the country is heading in the right direction, with a gradual normalization of macro conditions and a lower risk rate. They believe that the sovereign has a good chance of avoiding a new bailout agreement as gross domestic product is recovering and Greek government bond yields are falling. In the group’s view, banks are well capitalized and will not need to raise new capital due to the current Troubled Asset Review, or the EU-wide stress test.
- Poland’s ruling party has changed its approach toward helping the county’s foreign-currency mortgage holders, seeking to focus only on the most troubled households. This new plan may cost banks 2.8 billion zloty per year, less than a third of the previous bill’s price tag. Banks were the best performing stocks trading on the Warsaw stock exchange.
Threats
- The leader of Catalonia, Mr. Puigdemont in his Tuesday speech, said the region has won the right to be independent as a result of the referendum vote. He and other Catalonian leaders signed the declaration of independence, but he created confusion by saying that he is “suspending the effects of the declaration of independence” for more talks with Madrid. The Spanish government asked for clarification and gave Catalonia eight days to respond.
- Poland’s promotion from emerging market to developed market status in the FTSE-Russel Index, which will take place in September 2018, will trigger $340 million of outflows from passive funds, according to JPMorgan. JPMorgan expects the weight of Poland in the FTSE Developed All Cap ex-US Index to be at 0.38 percent, compared with the current 1.6 percent weighting in the FTSE Emerging All Cap Index.
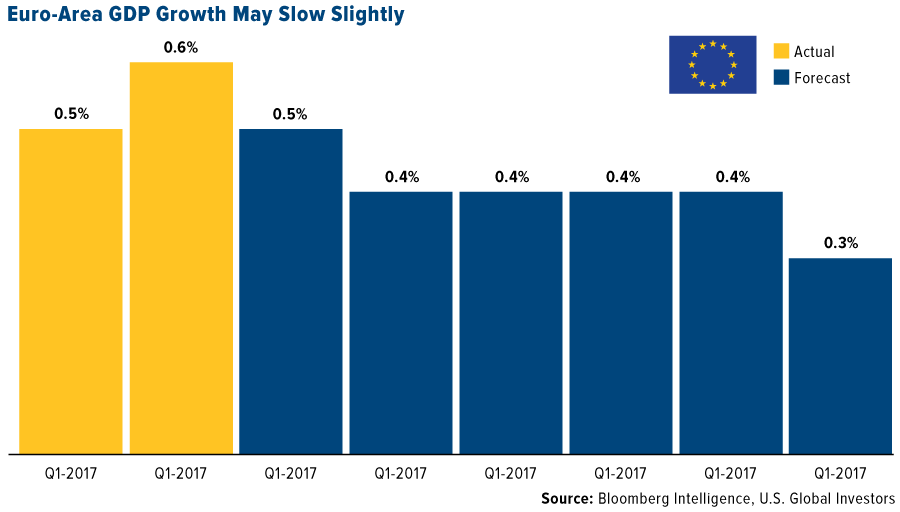
- The euro-area industrial sector made a strong showing in the second quarter, contributing 0.2 percentage points to the overall rate of gross domestic product growth of 0.6 percent. According to Bloomberg Intelligence (BI) it is unlikely to happen again in the third quarter and is one reason why they expect the region’s GDP to slow down to 0.5 percent in the next quarter.
Leaders and Laggards
By Frank Holmes
CEO and Chief Investment Officer
U.S. Global Investors
Source: U.S. Global Investors
U.S. Global Investors, Inc. is an investment adviser registered with the Securities and Exchange Commission (“SEC”). This does not mean that we are sponsored, recommended, or approved by the SEC, or that our abilities or qualifications in any respect have been passed upon by the SEC or any officer of the SEC.
This commentary should not be considered a solicitation or offering of any investment product.
Certain materials in this commentary may contain dated information. The information provided was current at the time of publication.
Some links above may be directed to third-party websites. U.S. Global Investors does not endorse all information supplied by these websites and is not responsible for their content.
All opinions expressed and data provided are subject to change without notice. Some of these opinions may not be appropriate to every investHoldings may change daily.
Holdings may change daily. Holdings are reported as of the most recent quarter-end. The following securities mentioned in the article were held by one or more accounts managed by U.S. Global Investors as of 06/30/2017:
CVR Refining LP
BHP Billiton Ltd.
Glencore PLC
Freeport-McMoRan Inc.
Norilsk Nickel PJSC
The Dow Jones Industrial Average is a price-weighted average of 30 blue chip stocks that are generally leaders in their industry.
The S&P 500 Stock Index is a widely recognized capitalization-weighted index of 500 common stock prices in U.S. companies.
The Nasdaq Composite Index is a capitalization-weighted index of all Nasdaq National Market and SmallCap stocks.
The Russell 2000 Index® is a U.S. equity index measuring the performance of the 2,000 smallest companies in the Russell 3000®, a widely recognized small-cap index.
The Hang Seng Composite Index is a market capitalization-weighted index that comprises the top 200 companies listed on Stock Exchange of Hong Kong, based on average market cap for the 12 months.
The Taiwan Stock Exchange Index is a capitalization-weighted index of all listed common shares traded on the Taiwan Stock Exchange.
The Korea Stock Price Index is a capitalization-weighted index of all common shares and preferred shares on the Korean Stock Exchanges.
The Philadelphia Stock Exchange Gold and Silver Index (XAU) is a capitalization-weighted index that includes the leading companies involved in the mining of gold and silver.
The U.S. Trade Weighted Dollar Index provides a general indication of the international value of the U.S. dollar.
The S&P/TSX Canadian Gold Capped Sector Index is a modified capitalization-weighted index, whose equity weights are capped 25 percent and index constituents are derived from a subset stock pool of S&P/TSX Composite Index stocks.
The S&P 500 Energy Index is a capitalization-weighted index that tracks the companies in the energy sector as a subset of the S&P 500.
The S&P 500 Materials Index is a capitalization-weighted index that tracks the companies in the material sector as a subset of the S&P 500.
The S&P 500 Financials Index is a capitalization-weighted index. The index was developed with a base level of 10 for the 1941-43 base period.
The S&P 500 Industrials Index is a Materials Index is a capitalization-weighted index that tracks the companies in the industrial sector as a subset of the S&P 500.
The S&P 500 Consumer Discretionary Index is a capitalization-weighted index that tracks the companies in the consumer discretionary sector as a subset of the S&P 500.
The S&P 500 Information Technology Index is a capitalization-weighted index that tracks the companies in the information technology sector as a subset of the S&P 500.
The S&P 500 Consumer Staples Index is a Materials Index is a capitalization-weighted index that tracks the companies in the consumer staples sector as a subset of the S&P 500.
The S&P 500 Utilities Index is a capitalization-weighted index that tracks the companies in the utilities sector as a subset of the S&P 500.
The S&P 500 Healthcare Index is a capitalization-weighted index that tracks the companies in the healthcare sector as a subset of the S&P 500.
The S&P 500 Telecom Index is a Materials Index is a capitalization-weighted index that tracks the companies in the telecom sector as a subset of the S&P 500.
The NYSE Arca Gold Miners Index is a modified market capitalization weighted index comprised of publicly traded companies involved primarily in the mining for gold and silver.
The Consumer Price Index (CPI) is one of the most widely recognized price measures for tracking the price of a market basket of goods and services purchased by individuals. The weights of components are based on consumer spending patterns.
The Purchasing Manager’s Index is an indicator of the economic health of the manufacturing sector. The PMI index is based on five major indicators: new orders, inventory levels, production, supplier deliveries and the employment environment.
The S&P/TSX Venture Composite Index is a broad market indicator for the Canadian venture capital market. The index is market capitalization weighted and, at its inception, included 531 companies. A quarterly revision process is used to remove companies that comprise less than 0.05% of the weight of the index, and add companies whose weight, when included, will be greater than 0.05% of the index.
The U.S. Trade Weighted Dollar Index provides a general indication of the international value of the U.S. dollar. The S&P 500 Integrated Oil & Gas Index is a capitalization-weighted index. The index was developed with a base level of 10 for the 1941-43 base period. The S&P 500 Oil & Gas Equipment & Services Index is a capitalization-weighted index. The index was developed with a base level of 10 for the 1941-43 base period. The FTSE Developed All Cap ex US Index is a market-capitalization weighted index representing the performance of large, mid and small cap companies in developed markets, excluding the USA. The FTSE Global All Cap Index is a market-capitalization weighted index representing the performance of large, mid and small cap companies in Developed and Emerging markets. The University of Michigan Confidence Index is a survey of consumer confidence conducted by the University of Michigan. The report, released on the tenth of each month, gives a snapshot of whether or not consumers are willing to spend money. The Consumer Price Index (CPI) is one of the most widely recognized price measures for tracking the price of a market basket of goods and services purchased by individuals. The weights of components are based on consumer spending patterns. The National Federation of Independent Business’s (NFIB) Index of business optimism is based on responses from 1221 member firms. The FTSE Bursa Malaysia Index Series is a broad range of real-time indices, which cover all eligible companies listed on the Bursa Malaysia Main and ACE Markets. The indices are designed to measure the performance of the major capital segments of the Malaysian market, dividing it into large, mid, small cap, fledgling and Shariah-compliant series, giving market participants a wide selection and the flexibility to measure, invest and create products in these distinct segments. The Caixin China General Services PMI (Purchasing Managers’ Index) is based on data compiled from monthly replies to questionnaires sent to purchasing executives in over 400 private service sector companies. The index tracks variables such as sales, employment, inventories and prices. The Caixin China Manufacturing PMI (Purchasing Managers’ Index) is based on data compiled from monthly replies to questionnaires sent to purchasing executives in over 400 private manufacturing sector companies.

 As many of you know, copper is often seen as an indicator of economic health, historically falling when overall manufacturing and construction is in contraction mode, rising in times of expansion.