INFOGRAPHIC: The world economy in one visualization
This data visualization is the most simple breakdown we have seen showing the composition of the world economy.
Publishers note: stay tuned over the next week as we release some exciting new infographics covering topics from Cybercrime to Mobile Payments.

To take it one step further, the visualization also shades the countries by continental geography, to easily see the relative economic contributions of North America, Europe, South America, Asia, Oceania, and Africa.
Original graphic by: How Much
More News
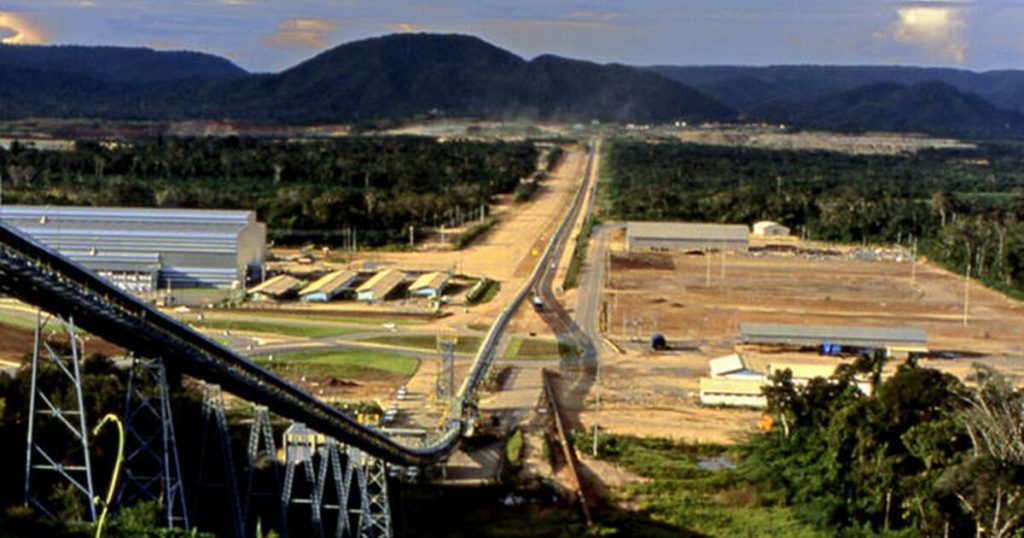
Brazil’s red tape is ‘cooling’ investment, mining group says
Big miners are expected to invest $68.4 billion in Brazil between 2025-2029, a figure that could be higher if the permitting process were streamlined, Ibram CEO says.
March 10, 2025 | 01:27 pm

Major copper producer Peru readies US delegation amid tariff threat
“The rules of the game are changing quickly under the new North American administration,” Energy and Mines Minister Jorge Montero said on Monday.
March 10, 2025 | 10:46 am
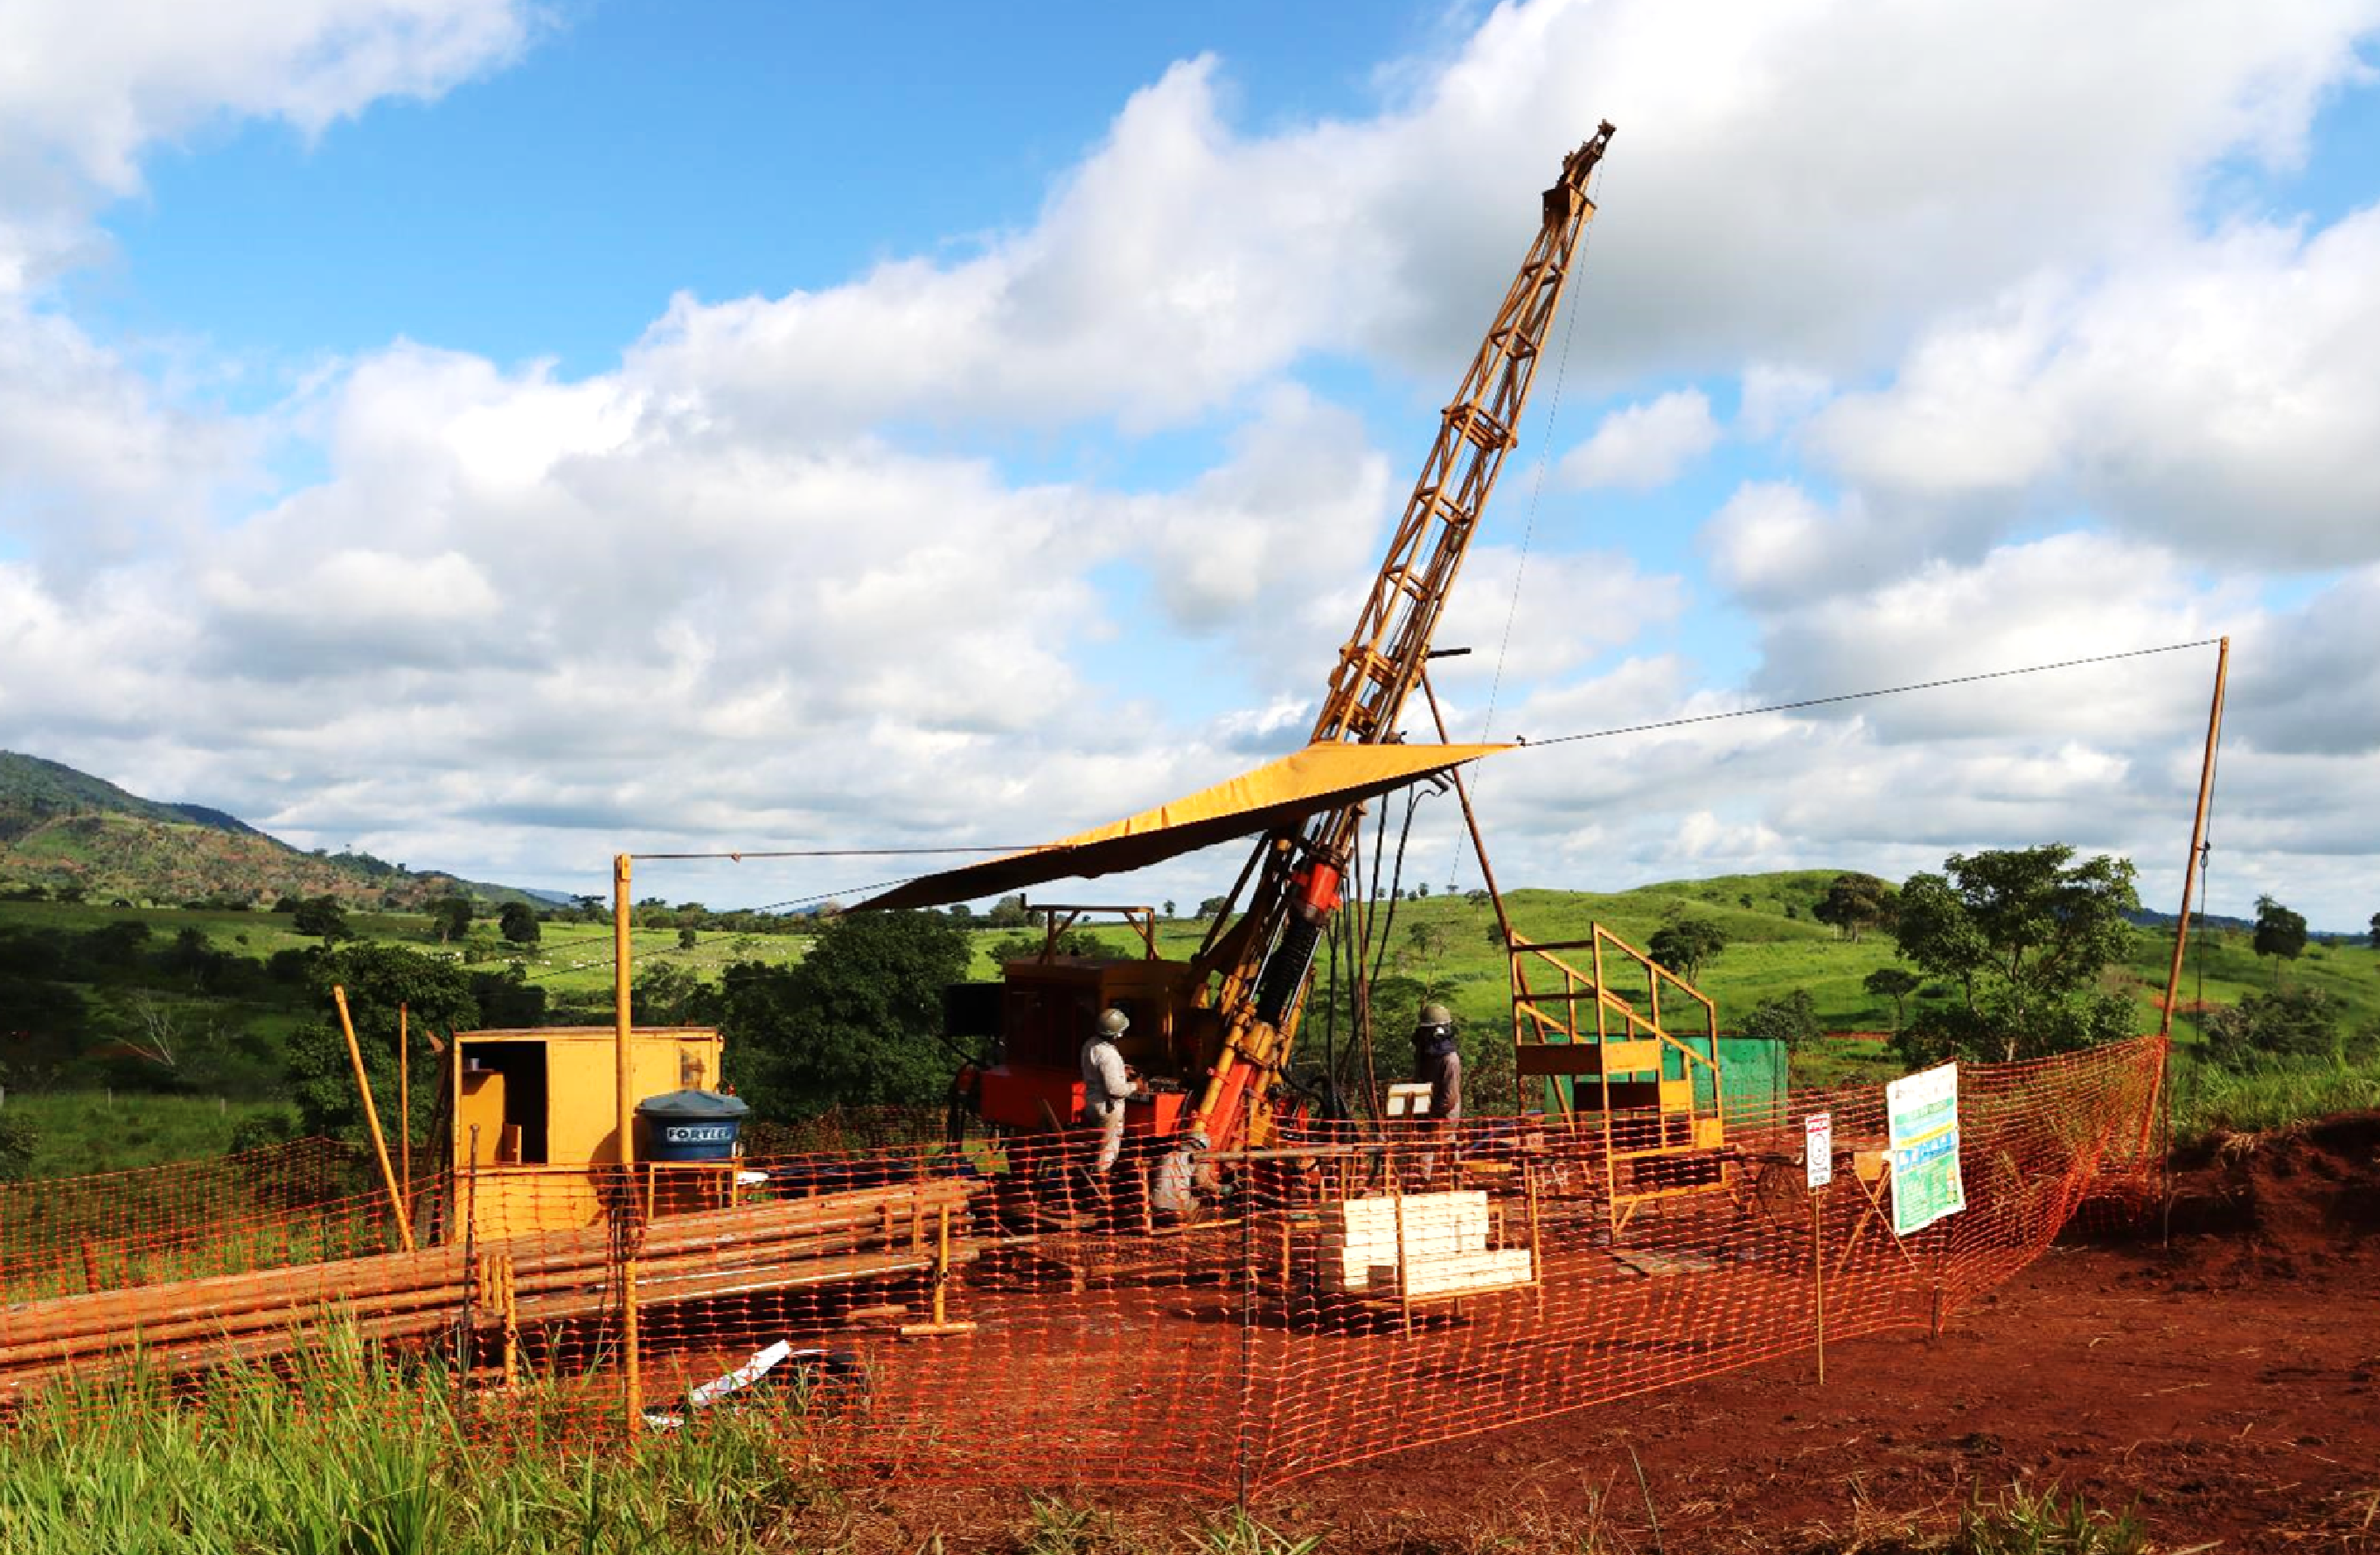
Meridian hikes Cabaçal gold-copper project value by 71% in Brazil after new study
Updated report for the project in Brazil increases its post-tax net present value (NPV) by over 66% to nearly $1 billion.
March 10, 2025 | 10:08 am
{{ commodity.name }}
{{ post.title }}
{{ post.excerpt }}
{{ post.date }}
Comments