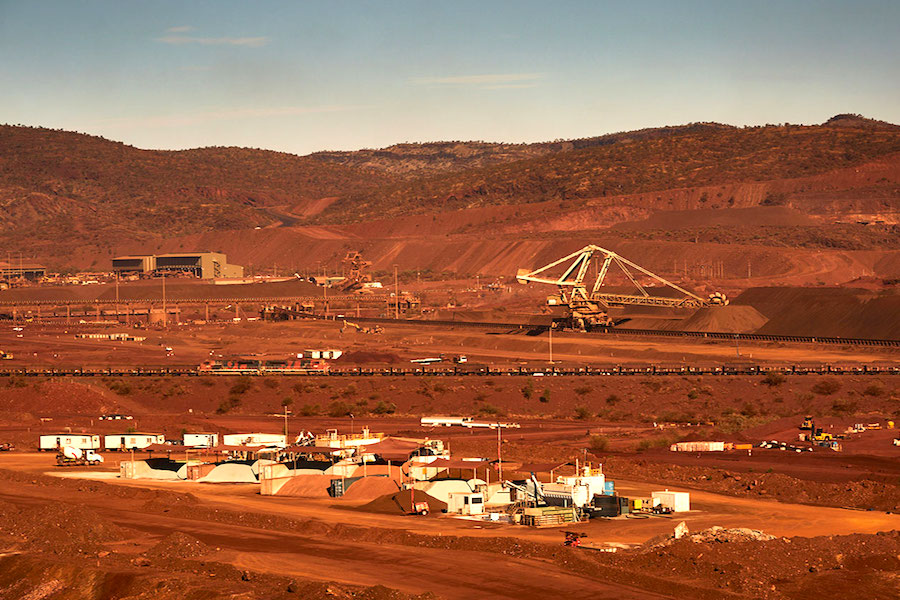
BHP’s iron ore, copper output surge on mine improvements
Production rose because of supply chain improvements, with a record amount of iron ore delivered from the Central Pilbara hub.

In the above data visualization, every attempted Chinese merger and acquisition (M&A) overseas over $100 million is sorted by country and industry. Showing over 1,250 attempted transactions (excluding bonds), this list includes both successful and failed attempts in order to help visualize the ebb and flow of Chinese investments up until mid-2014.
This fantastic data was compiled and visualized by South China Post, and there is an even betterinteractive version hosted on their site.
The largest successful transaction was in 2012, when state-owned CNOOC bought Canadian oil and gas giant Nexen for $15.1 billion. With the crash in energy prices, just years later the Chinese parent company is looking at enormous writedowns exceeding $5 billion on its Nexen assets.
Chinalco, the world’s second largest alumina miner, bid for some of Rio Tinto’s assets in 2008 in what would be the second largest M&A transaction on the list, but the deal eventually fell through.
Chinese investments rose over 50% in the United States from 2012, hitting a high of over $14 billion in 2014.