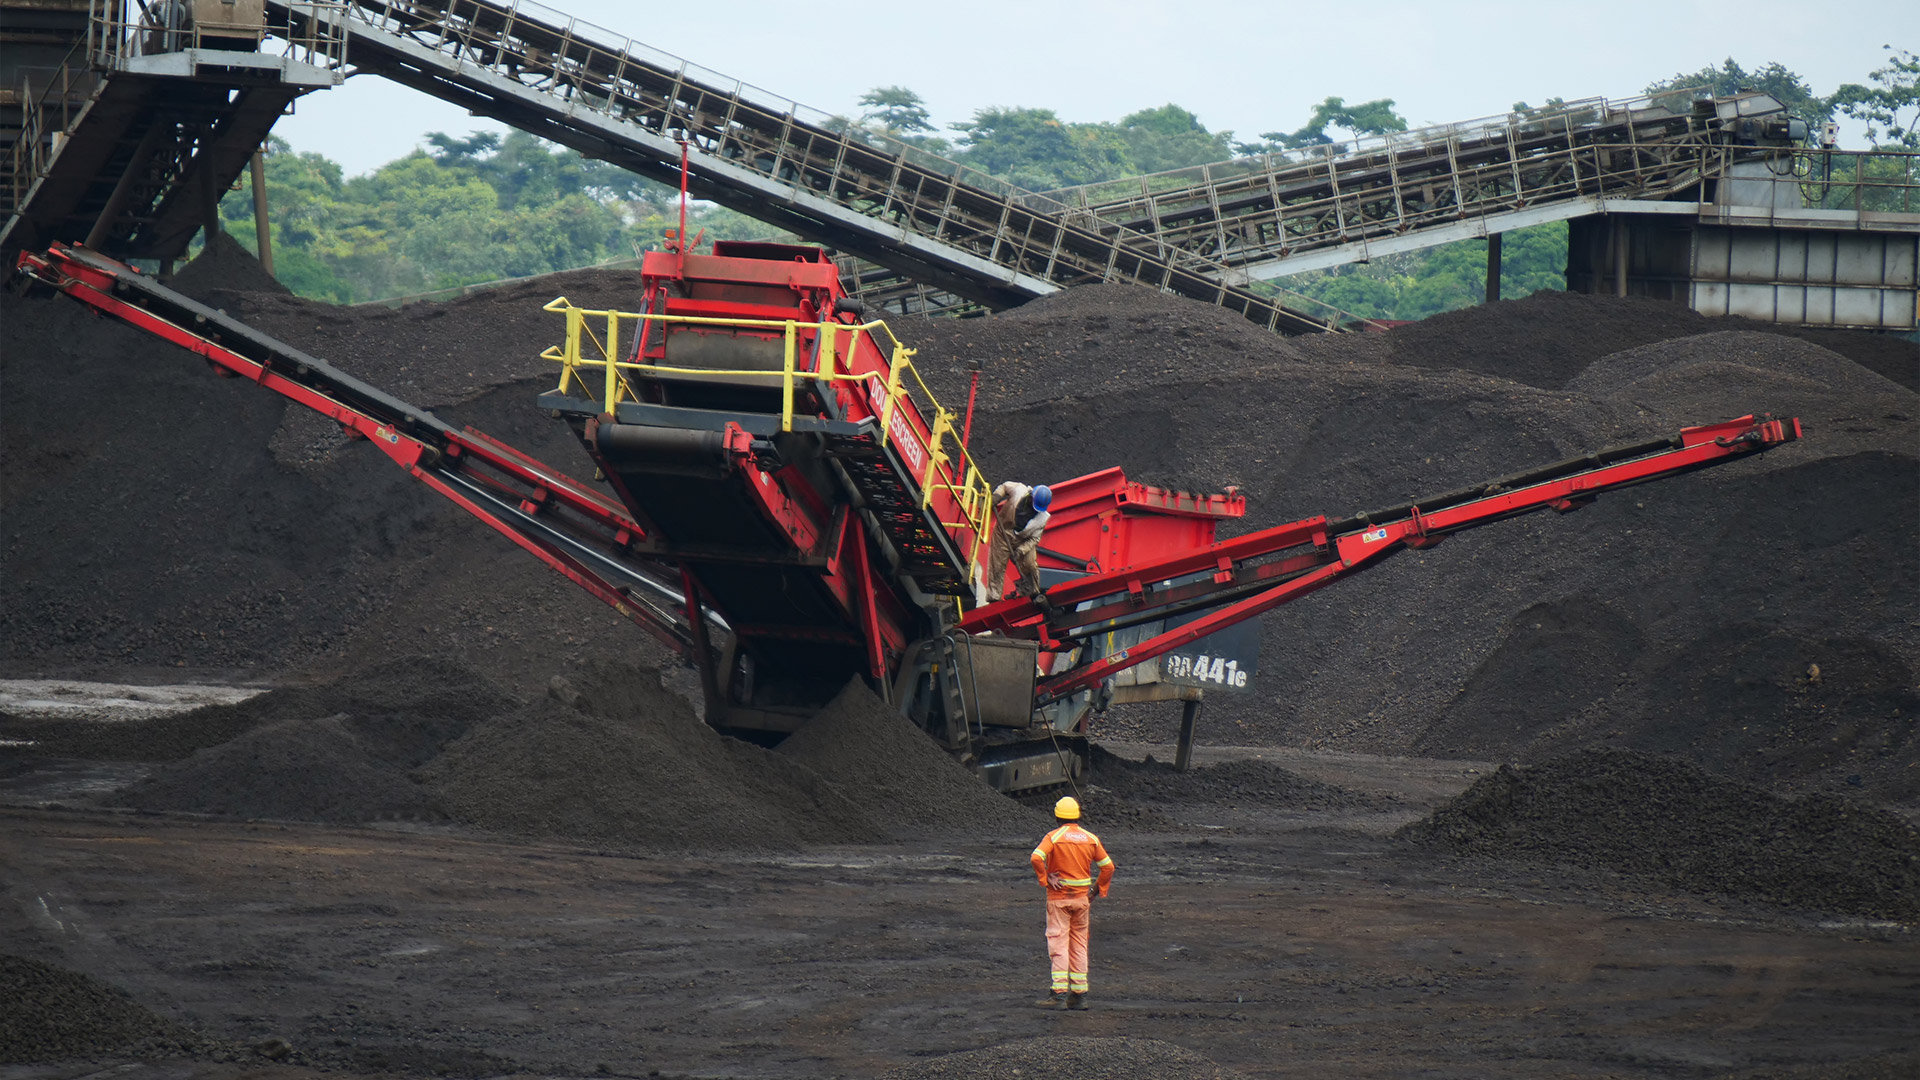
INFOGRAPHIC: Moving tonnes of earth for a gram of gold
ixtract puts into perspective the rarity of gold comparing the total amount ever produced with annual iron ore production. Explore more infographics like this one on the web's largest information design community - Visually.
You've reached your limit of free weekly articles
Keep reading MINING.COM with a TNM NEWS+MARKETS Membership.
TNM Memberships is your key to unlocking access to the best news, insights, and data in the mining industry.
Get Started with a free 45-day Trial ** Credit card required to begin free trial. Your card will be charged 45 days from signup. You will receive an email notification seven (7) days before the free trial period ends.
Already a Member?
Sign inSubscribe for Unlimited Access
Enjoy unlimited News Stories and Specialty Digests, along with Mining and Metal Market insights as part of your NEWS+MARKETS Membership. Or go even deeper with our Global Mining Data platform, TNM Marco Polo, included with your NEWS+DATA Membership.
Explore Full Membership Benefits


