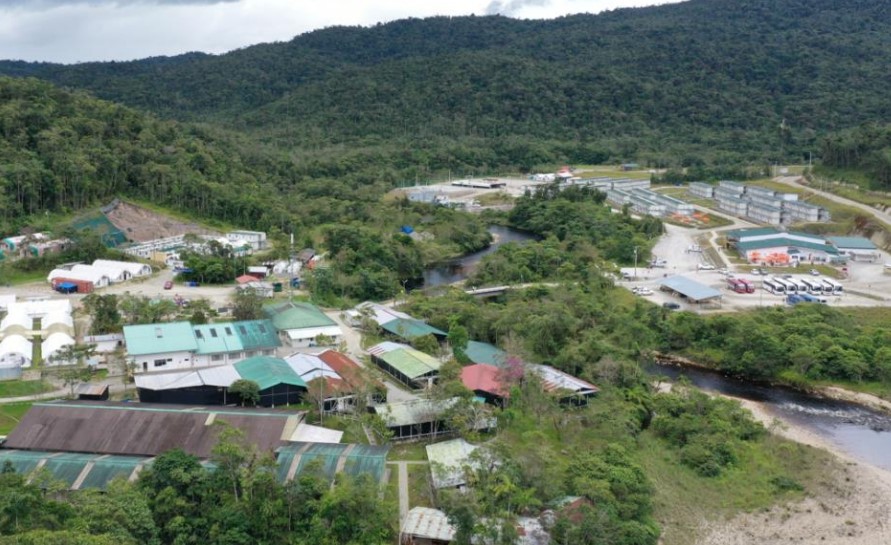
Lundin Gold more than triples Bonza Sur deposit length near Fruta del Norte
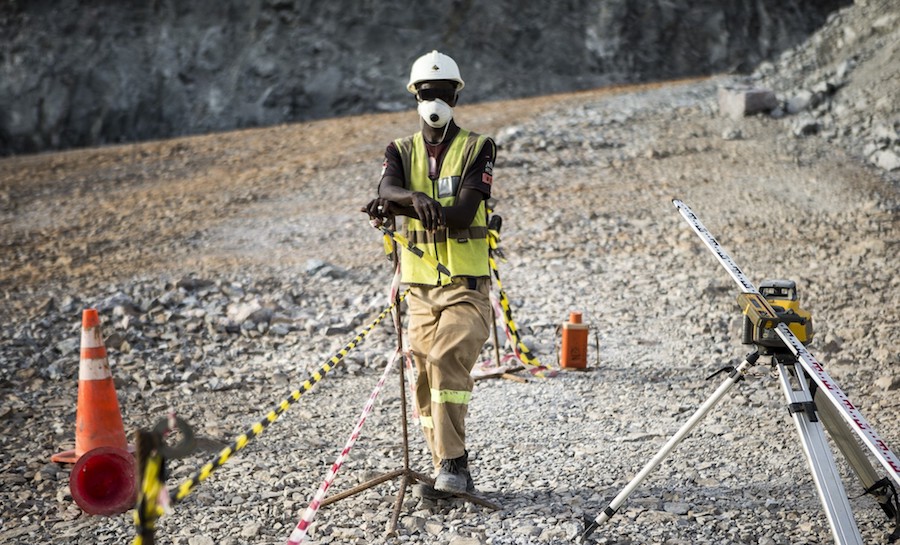
The Bonza Sur deposit was discovered in 2023 through drilling a geochemical soil anomaly 1 km south of the FDN mine.
By David Boleneus, Geologist, CostMine Div.
InfoMine USA Inc., Spokane, Washington, USA
The uncertain future of metal prices raises considerable concern, or in some cases, panic, including layoffs, mine shutdowns, and need for mine-site or other company and personnel adjustments. This uncertainty has now replaced euphoric attitudes of 2010-2012 as the direct effect of falling metal prices over past months. The question that remains unanswered is: How far will metal prices fall? Are prices stable or near a bottom? In effort to keep customers informed, below is an excerpt to the latest quarterly (July, 2103) Cost Indexes-Metal Prices report for users of CostMine’s Mining Cost Service.
Average metal prices for the three-month period ending June, 2013 show all metal prices reported here retreating (Table 1). Falling prices were led by silver which decreased most at minus 26.8 percent ending at $21.15 per tr. oz. and the price for lead showing the smallest decrease of minus 0.3 percent ending the month at 114.62 cents per pound.

Propensity for Fall (or rise)
In order to understand how current metal prices (June 2013) compare to historic metal prices over the longer term, below is a comparison of the current price with the average price over a ten-year period (from January, 2004). This comparison presumes that prices over a longer term could signal a stable level for metal prices (Table 2). Column (a) is the average of monthly prices across the period since January 2004. Column (b) is the difference between the June 2013 metal price and the 10-year average price. Could these percentage differences indicate the likelihood for additional price adjustment? One can see that gold and palladium prices remain well above their 10-year average by more than 30 percent while nickel remains substantially below its 10-year average. Of the other metals, lead and silver remain at nearly 20 percent above their 10-year average while the remaining metals, copper, zinc, and platinum are within 10 percent of their 10-year average. All metals also lie within one standard deviation (a measure of statistical variance) of the 10-year average, with exception of palladium, indicated by (+++).

Figure 1 illustrates the change in metal prices over the recent period of over six years since January 2007. The cost index for #2 diesel fuel provides an interesting comparison.[2] Some observations can be highlighted. The rapid fall of metal prices starting second quarter of 2008 coincides with onset of economic recession. Rising prices following the recession also coincides with recovery in all major economic indicators.[3] All metal prices have been on a downward trend since their peak in early 2011, a trend also mirrored by the index for #2 diesel fuel.


|