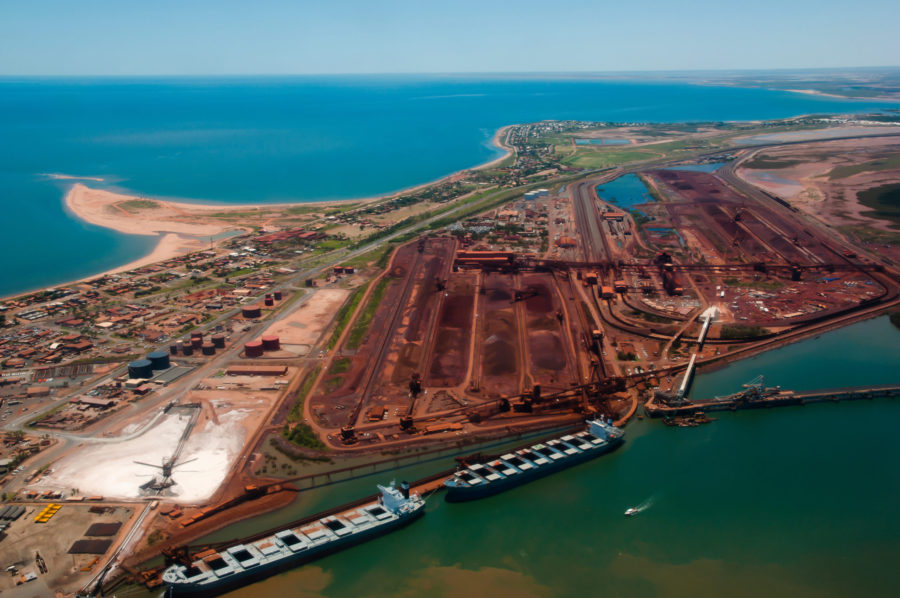
Ports for Australia’s Pilbara iron ore region closed due to cyclone
Port Hedland, about 1,300 km (800 miles) north of Western Australia's state capital, Perth, is the world's biggest export point for iron ore.
Friday saw a broad rally in metals and minerals with copper – the bellwether of the industry – adding 3% to bring its gains over the past month to more than 15%. Given its widespread use the power, telecoms and...
You've reached your limit of free weekly articles
Keep reading MINING.COM with a TNM NEWS+MARKETS Membership.
TNM Memberships is your key to unlocking access to the best news, insights, and data in the mining industry.
Get Started with a free 45-day Trial ** Credit card required to begin free trial. Your card will be charged 45 days from signup. You will receive an email notification seven (7) days before the free trial period ends.
Already a Member?
Sign inSubscribe for Unlimited Access
Enjoy unlimited News Stories and Specialty Digests, along with Mining and Metal Market insights as part of your NEWS+MARKETS Membership. Or go even deeper with our Global Mining Data platform, TNM Marco Polo, included with your NEWS+DATA Membership.
Explore Full Membership Benefits


The new Mining Power Rankings are live. Vote for the sector’s leaders in each of the Large-, Small-, and Micro-Cap leagues.