Mandalay Resources Corporation announces fourth quarter and 2011 full year financial results

TORONTO, March 12, 2012 /CNW/ – Mandalay Resources Corporation (“Mandalay” or the “Company”) (TSX: MND, MND.WT) announced today the release of its audited consolidated financial results for the fourth quarter and year ended December 31, 2011, together with its Management’s Discussion and Analysis (“MD&A”) for the corresponding periods.  All currency references in this press release are in U.S. dollars except as otherwise indicated. A complete copy of the Company’s financial statements for the fourth quarter and year ended December 31, 2011, together with the MD&A, can be accessed under the Company’s profile on www.sedar.com and on the Company’s website atwww.mandalayresources.com.

Brad Mills, Chief Executive Officer of Mandalay, commented: “For the year ended December 31, 2011, our second full year of production and sales, the Company is pleased to report record revenues of $92.16 million, record EBITDA of$32.01 million, and record net income of $18.48 million ($0.07 per share). These results are due to a full year of production both at the ramping-up Cerro Bayo gold-silver mine in Chile and at the Costerfield gold-antimony mine inAustralia. In 2010, when only Costerfield was producing and selling, revenue was $20.62 million, EBITDA was $1.75 million and we generated a loss of $3.42 million (loss of $0.02 per share).”

Mr. Mills also commented: “The Company is on track to deliver significant earnings, EBITDA and cash flow growth again in 2012 as we expect the Cerro Bayo silver-gold mine will reach full production by the fourth quarter and the Costerfield gold-antimony mine will achieve more stable operations. We continue to pursue an extensive exploration program in 2012 with 90,000 metres of drilling planned at Cerro Bayo, Costerfield, and the La Quebrada copper-silver project. Having announced significant reserve and resource increases for 2011 at both mines in February, the Company is considering early start of the fourth mine at Cerro Bayo and development of the Cuffley lode at Costerfield. If approved, these projects should support significant growth into 2013 and 2014.”

2011 Fourth Quarter Financial Highlights

The following table summarizes the Company’s financial results for the three months ended December 31, 2011 and 2010:

Quarter ended 
December 31, 2011
Quarter ended 
December 31, 2010
$ $
Revenue 24,233,020 8,322,097
EBITDA 3,376,244 2,324,330
Profit from mine operations 3,236,316 2,662,449
Net Income 955,754 1,740,990
Total assets 138,894,858 96,160,457
Total liabilities 39,923,892 33,875,246
Earnings/(Loss) per share 0.00 0.01

During the quarter ended December 31, 2011, the Company achieved revenue of $24,233,020 and EBITDA of$3,376,244. Net income was $955,754 ($0.00 per share), including a non-cash, fair-value charge of $2,832,516 related to change in value of our silver and gold put options and silver note payable and deferred tax income of $4,450,865. Underlying net loss, before application of these non-cash adjustments was $662,596 (negative $0.01 per share).

Fourth quarter profit was reduced due to the impact of negative price adjustments on previously booked shipments as metal prices declined in the second half of the year. These adjustments reflected both final settlement of older shipments and provisional adjustments on more recent shipments that were required to more accurately reflect the price-related adjustment mechanisms in its sales contracts. The total adjustment of revenue in the fourth quarter, and thus of EBITDA and net income, was $1,480,284 ($0.01 per share).  This equates to a lower silver price achieved of $5per ounce of silver sold in the fourth quarter versus the quarterly London average silver price.  In the fourth quarter of 2010, all costs at Cerro Bayo were being capitalized according to the restart plan, and no concentrate production or sales occurred. Net income for the fourth quarter of 2011 was $955,754 ($0.00 per share) versus income in the same period last year of 1,740,990 ($0.01 per share).

2011 Fourth Quarter Operational Highlights

The following table summarizes the Company’s production and sales volumes for all four quarters of 2010 and 2011.

Production

Metal Source Q1, 2010 Q2, 2010 Q3, 2010 Q4, 2010 FY, 2010 Q1, 2011 Q2, 2011 Q3, 2011 Q4, 2011 FY, 2011
Gold (oz) Costerfield 1,483 2,001 1,848 2,330 7,662 4,528 2,856 2,057 2,803 12,244
Cerro Bayo 1,450 1,552 1,567 2,109 6,678
TOTAL 1,483 2,001 1,848 2,330 7,662 5,978 4,408 3,624 4,912 18,922
Antimony (t) Costerfield 201 282 267 356 1,106 512 413 305 346 1,576
Silver (oz) Cerro Bayo 339,366 284,324 299,679 395,296 1,318,665
Average quarterly prices
Gold US$/oz 1,108 1,194 1,227 1,367 1,386 1,506 1,703 1,685
Antimony US$/tonne 6,483 8,686 9,552 11,083 14,128 15,898 14,899 13,890
Silver US$/oz 16.84 18.33 18.91 26.34 31.67 38.56 38.83 31.81
Au Eq. (oz)1 Costerfield 2,659 4,052 3,927 5,216 15,854 9,747 7,216 4,725 5,655 27,343
Cerro Bayo 9,204 8,832 8,400 9,572 36,008
Total 2,659 4,052 3,927 5,216 15,854 18,951 16,048 13,125 15,227 63,351

Sales

Metal  Source Q1, 2010  Q2, 2010  Q3, 2010  Q4, 201 FY, 201 Q1, 2011  Q2, 2011  Q3, 2011  Q4, 201 FY 2011 
Cold (oz) Costerfield 1, 361 2,051 1,499 2,406 7,317 4,741 3,229 2,108 2,837 12,915
Cerro Bayo 204 1,297 1,690 2,347 5,538
TOTAL 1,361 2,051 1,499 2,406 7,317 4,945 4,526 3,798 5,184 18,453
Antimony (t) Costerfield 195 278 234 434 1,141 476 433 279 352 1,540
Silver (oz) CerroBayo 69,037 270,404 376,409 396,150 1,112,000
Average prices
Gold U5 $/oz 1,197 1,220 1,513 1,261 1,289 1,499 1,469  1,814 1,734 1,622
Gold Au Eq. US $/oz 1,197 1,220 1,513 1,261 1,285 1,499  1,469  1,814 1,734 1,631
Antimony US $/tonne 6,807 9,117 8,698 12,184  9,803  15,050 16,036  17,326 12,921  15,252
Silver US $/oz 29 40 40 27 35
Au Eq. (oz)2 Costerfield 2,470 4,129 2,844 6,599 16,042 9,521 7,955 4,773 5,460 27,709
Cerro Bayo 1,559 8,632 10,093 8,516 28,801
Total 2,470 4,129 2,844 6,599 16,042 11,080 16.587 14,866 13,977 56,510


  1. Au Eq. oz produced is calculated by multiplying the saleable quantities of Au, Ag, and Sb in the period by the respective average market prices of the commodities in the period, adding the three amounts to get a “total contained value based on market price”, and then dividing that total contained value by the average market price of Au in the period.  Average Au price in the period is the average of the monthly LME PM fix, average Sb price is the average of the monthly high and low Rotterdam warehouse prices, and average Ag price is the average of the monthly LondonBroker’s silver spot price, all reported in www.metalbulletin.com.  The monthly commodity prices are calculated as the average of the daily prices, with holiday and weekend day prices carried forward from the last business day.
  2. Au Eq. oz sold is calculated by dividing the total revenue with the realized gold price. Realized gold price is the weighted average of price realized in Costerfield and Cerro Bayo.

In the fourth quarter of 2011, Mandalay produced a quarterly record amount of silver and slightly more gold and antimony than in the previous quarter. In addition, record sales of 5,184 oz gold, 352 t antimony and 396,150 oz silver were achieved during the fourth quarter of 2011. These quarterly records were reached due to high mill head grades and throughput resulting in higher concentrate production and sales.

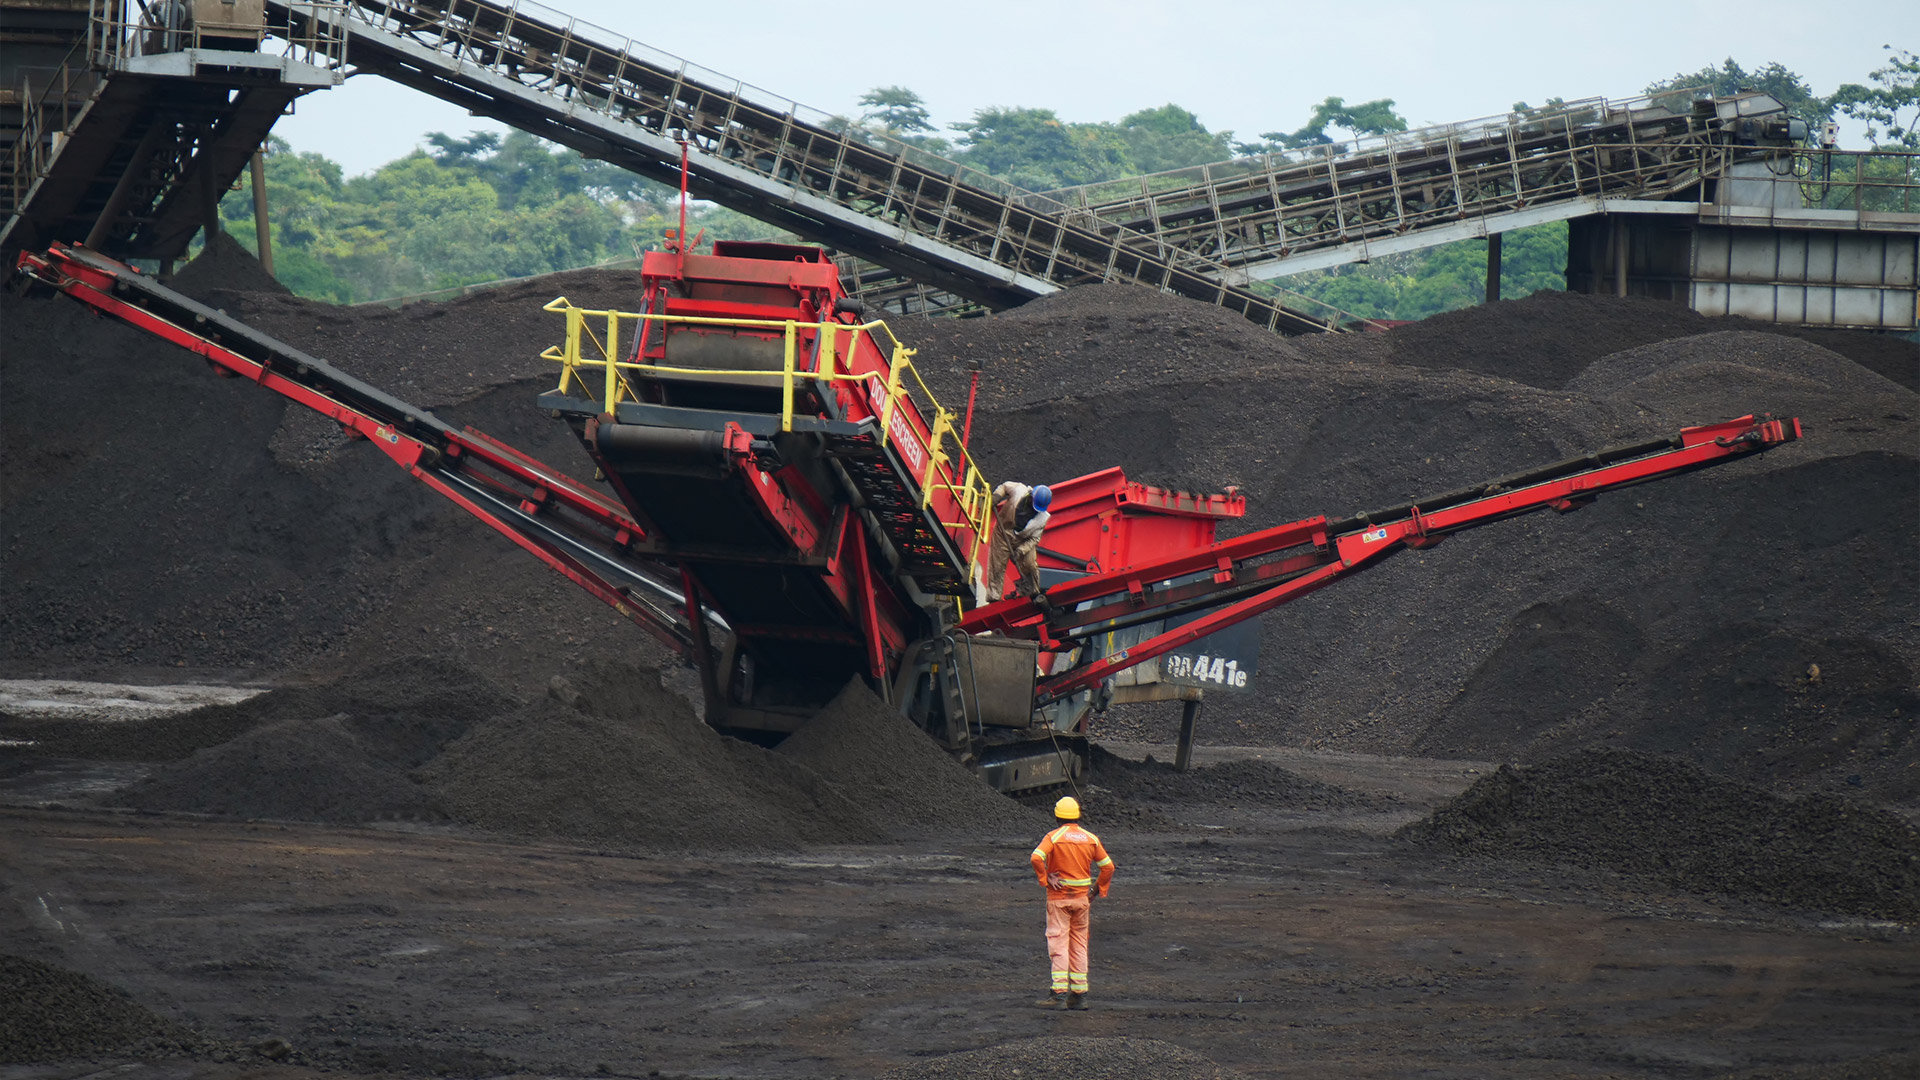
During the fourth quarter of 2011, the ramp-up of Cerro Bayo production continued on plan.  The mine produced a record of 76,140 dry tonnes of ore at an average grade of 1.08 g/t Au and 207.83 g/t Ag which, together with high mill head grades, enabled record metal production and sales during the quarter. Balanced capital development, operating development and stoping continued on the Dagny, Fabiola, Bianca, and Yasna veins, while capital and operating development continued on the Delia NW vein.

At Costerfield, the Company introduced and refined a new mining method of blast hole stoping with cemented rock fill (“CRF”). This innovation has caused the proportion of high grade stoping ore to increase relative to lower grade development ore, increasing the average grade of ore delivered to the plant as compared to the third quarter of 2011. The result was improving volumes of metal produced and sold and higher revenue, as well as a reduction in production cost per ounce of gold equivalent.

2011 Full-Year Financial Highlights

The following table summarizes the Company’s financial results for the year ended December 31, 2011 and 2010:

Year ended 
December 31, 2011
Year ended 
December 31, 2010
$ $
Revenue 92,163,852 20,618,328
EBITDA 32,013,588 1,751,223
Profit from mine operations 29,419,075 3,956,480
Net Income 18,477,317 (3,416,351)
Total assets 138,894,858 96,160,457
Total liabilities 39,923,892 33,875,246
Earnings/(Loss) per share 0.07 (0.02)

Revenue for 2011 was $92,163,852 versus $20,618,328 in 2010. Profit from mine operations before depletion and depreciation was $41,291,656 versus $7,153,009 in 2010. Net profit for 2011 was $18,477,317 or $0.07 per share versus a net loss of $3,416,351 or $0.02 per share in 2010. On a fully diluted basis, earnings per share in 2011 were$0.06 versus a loss per share of $0.02 in 2010.

2011 Full-Year Operational Highlights

Operational milestones recorded at Cerro Bayo in 2011 include:

  • The Fabiola and Dagny mines reached designed production rates of 400 tonnes per day by year end.  Also during 2011, capital and operating development began in the Delia NW mine, with first stoping planned for the first quarter of 2012.
  • The Cerro Bayo mine produced 207,783 tonnes of ore in 2011 versus 12,048 tonnes in 2010. Operating development in 2011 was 5,518 metres versus 856 metres in 2010; capital development during 2011 was 2,453 compared to 547 metres during the year 2010.
  • During 2011, the concentrator processed 270,456 tonnes of ore, producing 3,942 dry metric tonnes of concentrate, 6,678 ounces of saleable gold and 1,318,665 ounces of saleable silver. 2011 sales were 5,538 ounces of gold and 1,112,000 ounces of silver.

Operational milestones recorded at Costerfield in 2011 include:

  • For 2011, the Costerfield mine produced 66,156 tonnes of ore versus 53,021 in 2010. Operating development in year ended 2011 was 4,027 metres versus 3,526 metres in 2010 and capital development during the entire year 2011 was 1,027 metres compared to 931 metres in 2010.
  • During 2011, the concentrator processed 71,973 tonnes of ore, producing 4,706 dry metric tonnes of concentrate, 12,244 ounces of saleable gold and 1,577 tonnes of saleable antimony, this compares with the year 2010, in which 50,713 tonnes of ore were processed, producing 3,495 dry metric tonnes of concentrate, 7,661 ounces of saleable gold, and 1,106 tonnes of saleable antimony.
  • 2011 sales were 12,914 ounces of gold and 1,539 tonnes of antimony.  In 2010, 7,317 ounces of gold and 1,141 tonnes of antimony were sold.

Other Corporate Highlights in 2011

  • During 2011, the Company repaid $1,995,374 (C$2,000,000) of the Sprott loan and paid the first two of six installments of the Coeur silver contract totaling $1,258,313.
  • The Company repurchased 449,500 common shares at an average price of C$0.69 per share pursuant to its Normal Course Issuer Bid at a total cost of $294,303.
  • The Company entered into silver and gold put options to hedge commodity price risks and recorded a fair value measurement income on these options of $676,138 for the year ended December 31, 2011.
  • The Company significantly increased its Au, Ag and Sb reserves and resources as announced on February 23, 2012.

2012 Outlook

During 2012, the Company expects to complete the ramp-up of the Delia NW mine at Cerro Bayo with the objective of achieving total sustained production of 1,200 t/day by the fourth quarter of 2012. This ore mining rate will support an annual metal production rate of 25,000 to 30,000 oz Au and 3 to 4 million oz Ag. The Company intends to complete installation and commissioning of flotation automation equipment in the plant to deliver increased metal recovery. As well, it continues drilling with eight rigs in order to continue increasing resources and reserves with the objective of proving up significant new reserves to justify the early development of the Delia SE mine.  To this end, the Company has started the permitting process for the development of the Delia SE mine.

At Costerfield, the Company expects to continue refining the CRF stoping method to increase productivity and lower cost.  The 2012 target is for the mine and plant to average 6,000 tpm ore. The Company also intends to continue defining the extent of the Cuffley lode and prepare a Preliminary Economic Analysis for its possible development.

In 2012, Cerro Bayo unit costs are expected to decline to $4-5/oz of silver net of gold credits by the fourth quarter, with full year costs averaging approximately $7-9/oz of silver net of gold credits. Costerfield unit costs are expected to average between $1,000-$1,100/oz of gold equivalent in 2012, higher than previously expected because the mine will continue to incur higher than expected water handling and ground support costs.

The Company is planning to spend $18 million in 2012 on capital development at its existing operations and $13 million for purchase of property, plant and equipment. The Company also plans to spend $15 million on continued exploration. A further $10 million will be used to repay all of the Company’s existing indebtedness. All cash requirements for capital, exploration, and debt repayment are expected to be funded out of operating cash flow.

Update on Aysen Province Impact

At Cerro Bayo, roadblocks stemming from public protests in the Aysen Province of Chile forced the Company to delay its February shipment, resulting in the deferral of sales of approximately 200,000 ounces of silver and 2,000 ounces of gold into the second quarter of 2012.

The Company also estimates it has lost approximately 50,000 ounces of silver and approximately 500 ounces of gold production due to the cumulative impact of the slowdown related to the Aysen protests.  The lost production from the Aysen protests will not cause the Company to revise its full year guidance at this time. The roadblocks were removed in early March and the Company is now focused on returning to normal operations and shipping.

Conference Call

The Company is hosting a conference call to discuss its quarterly results on Tuesday, March 13 at 9:00 am (EST).  Dial-in information is below:

Local/International: 647.427.7450
Toll Free: 1.888.231.8191
Conference ID: 58937897

A replay of the call will be available until March 27, 2012.  Please dial in as follows:

Encore Toll Free Dial-in Number: 1.855.859.2056
Encore Local/International Dial-in-Number: 416.849.0833
Encore ID: 58937897

About Mandalay Resources Corporation

Mandalay Resources is a Canadian-based natural resource company with producing assets in Australia and producing and exploration projects in Chile. The Company is focused on executing a roll-up strategy, creating critical mass by aggregating advanced or in-production gold, copper, silver and antimony projects in Australia and the Americas to generate near-term cash flow and shareholder value.

Forward-Looking Statements

This news release contains “forward-looking statements” within the meaning of applicable securities laws, including statements regarding the Company’s expected growth in earnings and cash flow for 2012, its expected gold, silver and antimony production and cash costs of gold and silver production in 2012 and anticipated capital expenditures and exploration expenses in 2012. Readers are cautioned not to place undue reliance on forward-looking statements. Actual results and developments may differ materially from those contemplated by these statements depending on, among other things, changes in commodity prices and general market and economic conditions. The factors identified above are not intended to represent a complete list of the factors that could affect Mandalay. A description of additional risks that could result in actual results and developments differing from those contemplated by forward-looking statements in this news release can be found under the heading “Risk Factors” in Mandalay’s annual information form dated March 31, 2011, a copy of which is available under Mandalay’s profile at www.sedar.com. In addition, there can be no assurance that any inferred resources that are discovered as a result of additional drilling will ever be upgraded to proven or probable reserves. Although Mandalay has attempted to identify important factors that could cause actual actions, events or results to differ materially from those described in forward-looking statements, there may be other factors that cause actions, events or results not to be as anticipated, estimated or intended. There can be no assurance that forward-looking statements will prove to be accurate, as actual results and future events could differ materially from those anticipated in such statements. Accordingly, readers should not place undue reliance on forward-looking statements.

Non-IFRS Measures

This news release contains references to EBITDA, cash cost per ounce of gold equivalent produced and cash cost per saleable ounce of silver produced net of gold credits, all of which are non-IFRS measures and do not have standardized meanings under IFRS. Therefore, these measures may not be comparable to similar measures presented by other issuers.

The Company defines EBITDA as earnings before interest, taxes and non cash charges. EBITDA is presented as the Company believes it is a useful indicator of relative operating performance. EBITDA should not be considered by an investor as an alternative to net income or cash flows as determined in accordance with IFRS. For a detailed reconciliation of net income to EBITDA, please refer to page 10 of management’s discussion and analysis of the Company’s financial statements for the fourth quarter of 2011.

Cash cost per ounce of gold equivalent produced and cash costs per saleable ounce of silver produced net of gold credits, are presented because these statistics are key performance measures under control of the operations that management uses to monitor performance, to assess how the Company’s mines are performing, and to plan and assess the overall effectiveness and efficiency of mining operations. These performance measures should not be considered in isolation as a substitute for measures of performance in accordance with IFRS.  Equivalent gold ounces produced or sold is calculated by adding to saleable gold ounces produced or sold, the saleable antimony tonnes produced or sold times the antimony realized price divided by the gold realized price. The total cash operating cost associated with the production or sale of these equivalent ounces in the period is then divided by the equivalent gold ounces produced or sold to yield the cash cost per equivalent ounce produced or sold. The cash cost per ounce of silver produced net of gold credit is calculated by deducting gold revenue from the cash operating costs in the period and dividing the resultant number by the silver ounces produced in the period.