
Mining’s old guard needs strong medicine
A new report details subpar investor returns in the mining industry over the last decade, particularly big cap diversified companies which have not adapted to new realities.
The CPI data is going to be released today, so the markets are tense.
Gold moved slightly higher, but the very short-term resistance line based on the previous highs keeps gold’s gains in check.
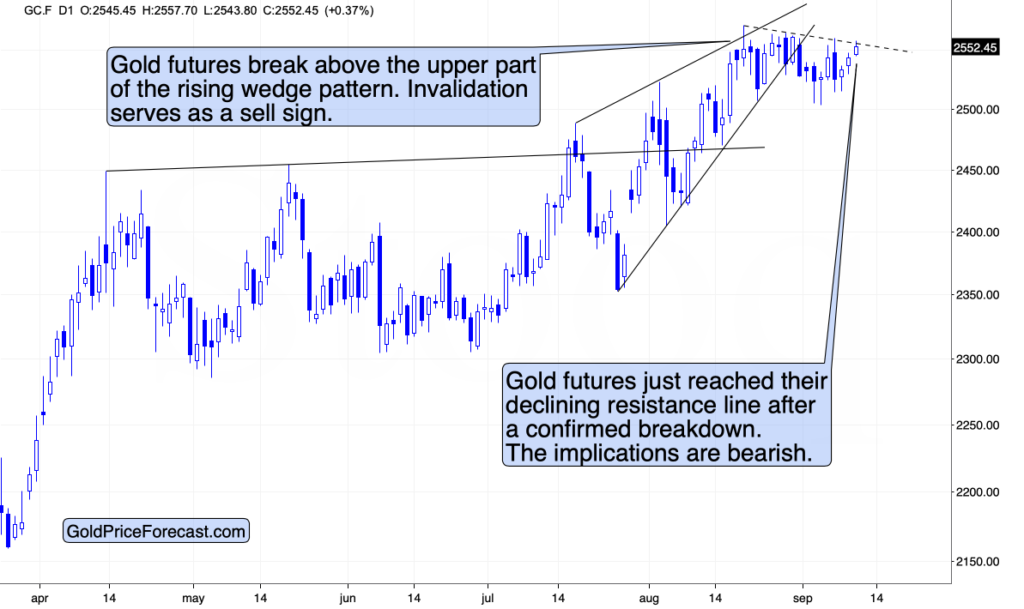
The fact that gold already confirmed the breakdown below its rising wedge channel makes the following declines likely from the short-term point of view.
And from the medium-term point of view, we get similar (but stronger) indication from the current seasonality. Afterall, we’re after the U.S. Labor Day.
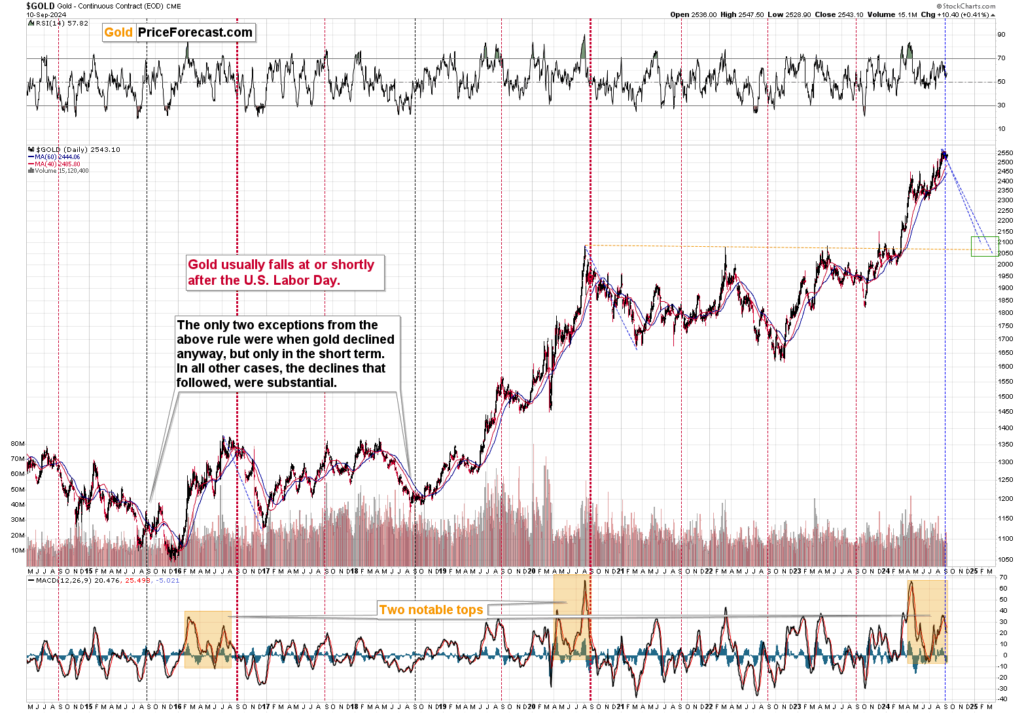
The bearish implications of this important point in time haven’t played out yet, but it doesn’t mean that they are any less likely to take gold lower in the following days or weeks. As I wrote previously, gold price doesn’t have to decline immediately after Labor Day – it could trade sideways for some time, and then decline in a meaningful way.
It’s not the exact timing that has been so consistent over the previous years, but the importance of the declines that (sooner or later) followed.
Given the similarity that we see in the MACD indicator (bottom of the above chart) to the 2020 and 2016 tops and the fact that those two years were also the U.S. presidential election years (just like the current year), it seems that we can expect much lower gold prices in the following weeks and months.
Let’s see what the GDXJ did in those years.
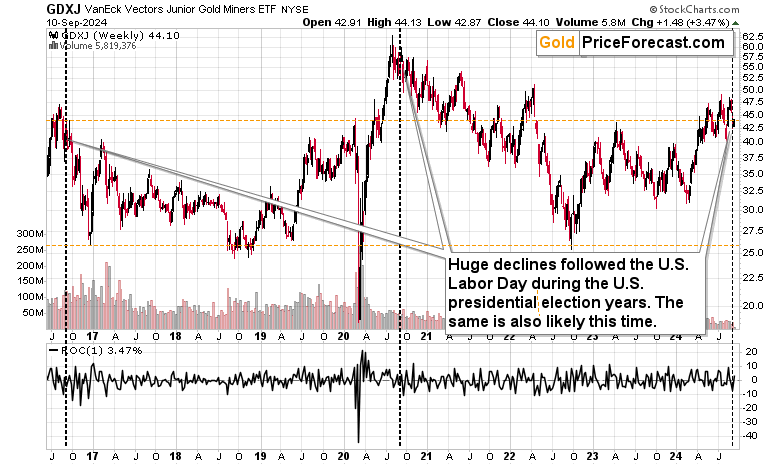
Of course, it declined. What’s not so obvious before one looks at the above chart is that those Labor Days were the starting points (approximately – the tops actually formed earlier, just like it happened this year) of really big declines in the junior mining stocks.
In particular, the 2016 case seems similar as the GDXJ is trading at very similar price levels (note the orange, dashed lines). If history rhymes, then we can expect the GDXJ to decline to its 2022 low or so. That would be an almost $20 downswing – a truly powerful one.
Now, in those two years, the stock market didn’t decline, and it’s quite likely to decline this year. This means that the declines in the GDXJ could be bigger than what we saw in 2016 or after the 2020 top. After all, the above chart includes one case when stocks plunged – in early 2020 during the Covid/lockdown scare – miners declined very fast in this case. The same was the case in 2008 when stock plunged.
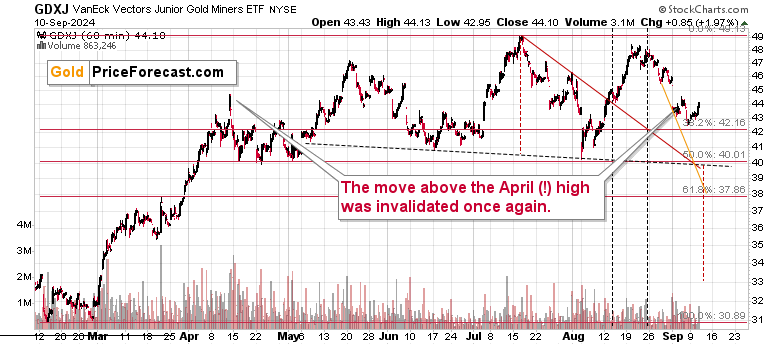
On a very short-term basis, we saw a rebound, which took place right at the triangle-vertex-based turning point. I previously wrote about the possibility that GDXJ could decline to about $40 and perhaps bottom there (for a short while) at this turning point (yesterday), but instead another – also probable – scenario happened. We got a small rebound.
This doesn’t change the fact that the two support lines and the 50% Fibonacci retracement still provide a quite strong (but short-term only) support at about $40, so we might get a rebound when GDXJ moves to this level.
Then – as I discussed above – miners would be likely to decline once again.


Comments