Fed tests gold upleg
Gold’s outlook and fundamentals remain really bullish.
We call ourselves Ahead of the Herd because we see things before others do. We know where to look for the early, and best, information that will help guide our investment decisions.
Right now there is all kinds of talk of a market meltdown and what looks like the early stages of a global recession. Some of the world’s greatest financial minds are warning that the longest bull market in history is finally over, and to batten down the hatches for the recessionary storm. Consider the following quotes from the Business section in last weekend’s Globe and Mail newspaper:
“The world economy is again in danger… Even if a global recession is averted, the pain of stagflation could persist for several years.” (World Bank President David Malpass)
“A hard landing is virtually inevitable.” (Bill Dudley, former president of the Federal Reserve Bank of New York)
“I said there’s storm clouds but I’m going to change it. It’s a hurricane. You’d better brace yourself.” (JPMorgan Chase CEO Jamie Dimon)
“ ‘Inflation shock’ worsening, ‘rate shock’ just beginning, ‘recession shock’ coming.” (BofA investment strategist Michael Hartnett)
“I think the recession is already staring us in the face.” (David Rosenberg, chief economist at Toronto-based Rosenberg Research)
The pundits aren’t wrong, but they’re late. If you browsed that article while still holding onto your equity positions that are underwater, you’re likely contemplating selling at a loss. Not a fun place to be. We warned you last year what was coming.
The Dow to gold ratio measures how many ounces of gold it would take to “buy the Dow”. The Dow Jones Industrial Average is a price-weighted index of 30 large corporations that represent the different sectors of the US economy, such as financial services, manufacturing and IT. Examples include American Express, Boeing and Intel.
The Dow to gold ratio expresses the DJIA as a multiple of the price of one ounce of gold. So for example, if the Dow is worth 35,000 points and the gold price is $1,750/oz, the Dow to gold ratio is 20. As Zacks reports, the ratio has fluctuated widely over history, trading as low as 1.0 during the stock market crash of 1980 to above 40 during the dot-com bubble of 2000.
For investors, the ratio is valuable because it tracks how gold has performed relative to corporate America. It can also be used to determine whether the stock market is undervalued or overvalued, and most importantly, signals when is the time to jump in or bail out.
Here are the rules of a trade that has worked extremely well for the past 100 years: when the Dow to gold ratio goes below five we buy the index. When the ratio goes above 15 we sell the Dow and buy gold.
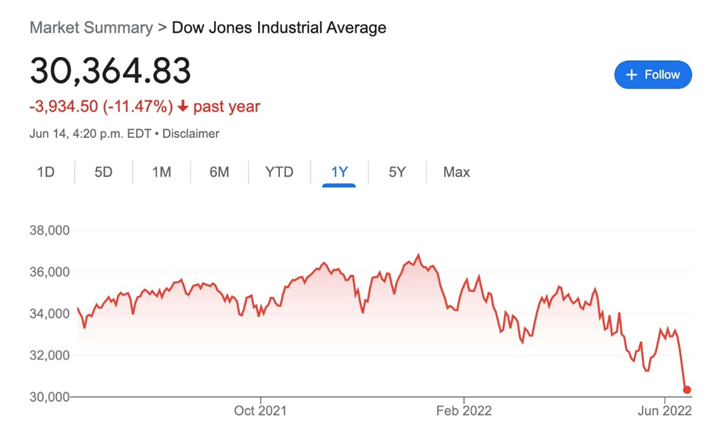
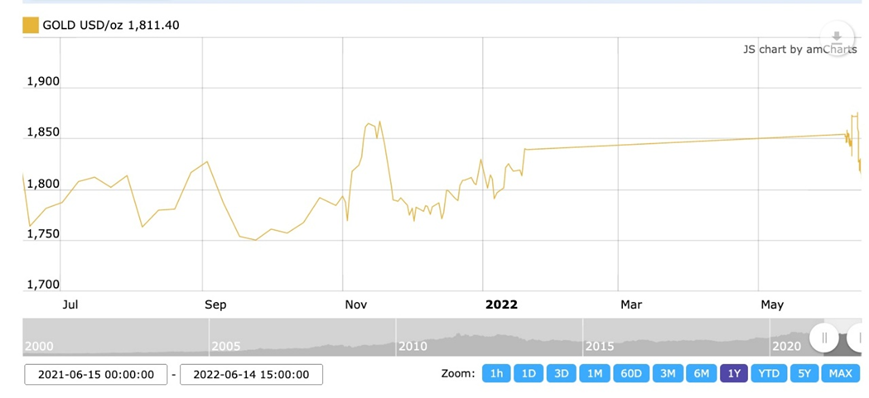
The Dow is currently trading at 30,364 and the gold price is $1,811, so the Dow to gold ratio is 16.7. The lower the ratio goes, the worse it is for stocks, and likely, the economic conditions.
At the end of every financial crisis, the Dow to gold ratio falls precipitously. In 2010 the ratio dropped to about 7, in 1980 it fell to 1.
The important point here, is that in each of the cases when the Dow to gold ratio moved higher than the historical average of 15, stocks were in a bubble. During these periods the federal government and the US Federal Reserve will do practically anything to ensure that the bubble continues, including the “quantifornication” policy of ultra-low interest rates and monetary easing.
(Californication is a brilliant 1999 song by the Red Hot Chili Peppers. Many of the lyrics reference the often insane, unrealistic, impossible dream images Hollywood sells to the world. Quantifornication is the term I coined for what the Federal Reserve is selling to the world – the unrealistic, insane fiat dream that the monetary policy employed by the Fed known as quantitative easing (QE), could fix the predicament we are in.)
The elephant in the room nobody wants to talk about is the debt crisis. Seeking Alpha contributor Ronald Surz wrote a piece where he points out that global debt has reached a record high. The official numbers are $184 trillion but Surz thinks that’s underestimated by a factor of 2.5X. The more likely figure he writes is $460 trillion, which is 560% of global GDP, and $215,000 per capita. The three most indebted countries are the US, China and Japan, which together represent about half of global debt.
Debt brought the world to its knees in 2008. Paradoxically, disaster was circumvented by doubling down with even more debt, deferring the consequences to sometime in the future. That future is rapidly approaching. In The Coming Global Financial Crisis: Debt Exhaustion, Charles Hugh Smith observes:
The global economy is way past the point of maximum debt saturation, and so the next stop is debt exhaustion: a sharp increase in defaults, a rapid decline in demand for more debt, a collapse in asset bubbles that depend on debt and a resulting drop in economic activity, a.k.a. a deep and profound recession that cannot be “fixed” by lowering interest rates or juicing the creation of more debt.
The fact is the Fed have never been successful in preventing a crash. There’s always a correction, it’s just a matter of when, and by how much. The Dow to gold ratio gives investors a vitally important signal as to when the stock market is overvalued and gives them a chance to sell before it’s too late.
If you still own all the stocks you did a year ago, when the stock market was highly overvalued (on June 15, 2021 the Dow was @ 34,299, compared to around 30,000 today), you’ve missed the boat. Or more accurately, you’re on a boat that’s sinking, scrambling for a life jacket.
Mixed metaphors aside, the fact is, you’re playing with fire when the ratio is over 15. It’s written in the charts.
Don’t say you weren’t warned. In an AOTH article published on August 11, 2021, I wrote the following:
We don’t know when the correction will occur, by how much and for how long it will last, all we know is that there has never been an occasion when a stock market bubble indicated by a high Dow to gold ratio, hasn’t popped.
Investors are scared stiff by the push by central banks worldwide to hike interest rates to the point at which skyrocketing inflation can be brought to heel, back into the normal range of around 2%.
That will be tough, with the current price spirals.
In the US, the Consumer Price Index (CPI) in May rose by 8.6% compared to a year ago, which is the worst inflation since 1981.
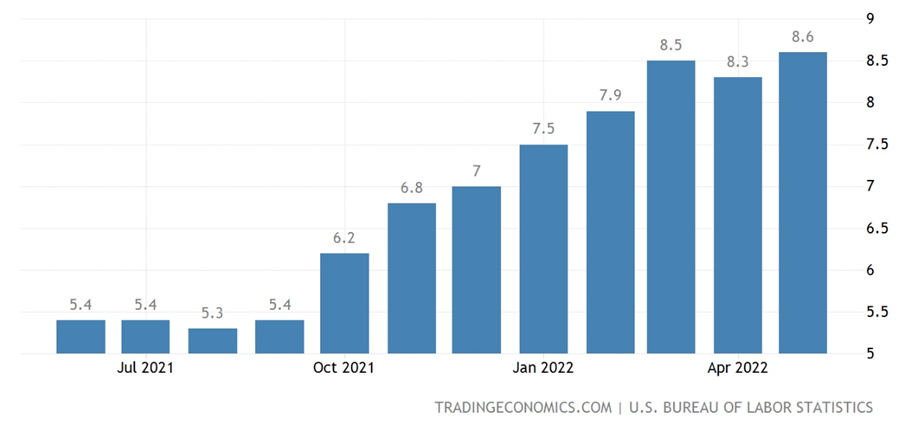
Canada’s isn’t quite as bad, quickening to 6.8% in April, but that was a 31-year high, and in May, prices climbed by 3.4%, year on year, the most since 2011.
On June 1 the Bank of Canada raised its benchmark interest rate to 1.5% and signaled more rate hikes are on the way. The higher rates are obviously affecting those most leveraged. A recent survey said nearly one in four Canadian home owners will be forced to sell if mortgage rates go any higher.
The US Federal Reserve, America’s central bank, raised rates by half a percentage point last month for the first increase since 2000, to a range of between 0.75% and 1%. When the Fed meets again this week, they are considering surprising markets with a 75 basis points increase (0.75%) following last week’s Labor Department report that showed a larger than expected jump in prices.
The Fed’s hawkish tone has many investors thinking the Fed is intending to “crash the market” with rate hikes, similar to what happened with the Federal Reserve board led by Paul Volcker in the late 1970s, early ‘80s. (From 1979 when the prime rate averaged 11.2%, the Fed drove rates to 21.5% in 1981, causing the 1981-82 recession during which the unemployment rate climbed to over 10%).
This is causing a great deal of stock market volatility.
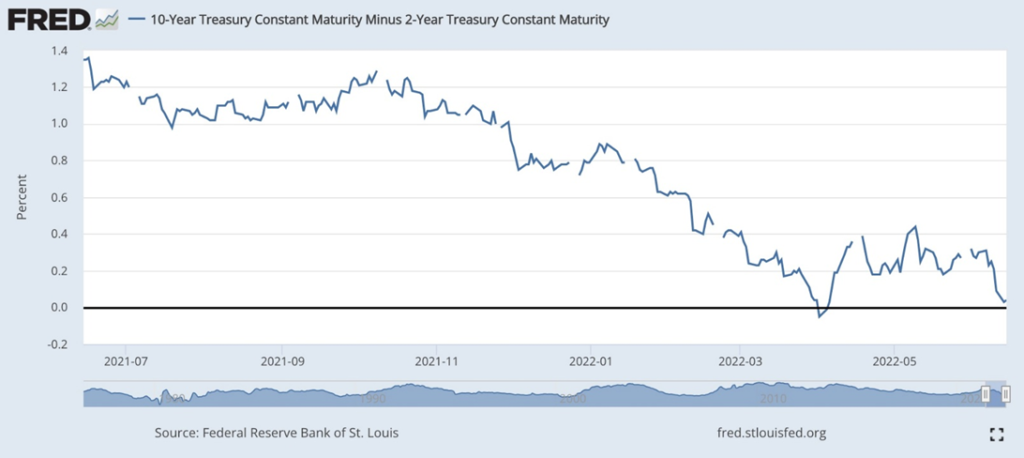
This week another key recession indicator emerged in the inverted yield curve.
In a typical healthy market, the yield curve (typically the spread between the US 10-year Treasury note and the 2-year note) shows lower returns on short-term investments and higher yields on long-term investments. This makes sense, as investors earn more interest for tying up their money for longer. The yield curve is said to “invert” when short-term yields are higher than long-term yields.
The yield curve has inverted 28 times since 1900, and in 22 of those times, a recession followed. For the last six recessions, a recession began six to 36 months after the curve inverted.
As an article in Advisor Perspective reports, this yield curve recession indicator is so reliable, it cannot be argued. Author Erik Conley writes: “I don’t know of any economists who dispute this assertion; history is history and not theory.”
Well guess what? The yield curve is once again inverting, signaling the next recession is not far off.
Two-year yields rose to around 3.25% on Monday, June 13, higher than the 10-year interest rate, causing the first yield curve inversion since April, as the FRED chart below shows the line dipping below 0.
Before April, the last time the 2/10 year curve inverted was in 2019, and the following year the US entered a recession.
As for why this is happening, Reuters gives the following explanation:
Yields of short-term U.S. government debt have been rising quickly this year, reflecting expectations for a series of rate hikes by the Fed. Longer-dated government bond yields have moved at a slower pace amid concerns policy tightening may hurt the economy.
One source identified by AOTH said he expects that if the 10-year Treasury note moves anywhere near 4%, the markets will rapidly start to meltdown and that is when the fed will be forced to reconsider [raising rates] if not sooner.
The smart money is saying the Fed will crash the market with rate increases too high for the US economy to handle. Few now believe that Chairman Powell and his cabal of central bankers can engineer a “soft landing” for the economy, where wages, job growth and consumer prices ease without crippling corporate profits.
We are currently seeing consumers cracking under the pressure of 40-year high inflation. This week, the Wall Street Journal reported US retail sales declined in May, as consumers felt the pinch from inflation, higher gasoline prices and rising interest rates that make car purchases more expensive. Economists pay close attention to consumer spending as it makes up about 70% of the US economy.
The market sell-off has obviously begun but it’s going to get worse. Economists appear to fall into two camps, one that sees the economy on the verge of deflation, brought on by a recession caused by central bank tightening; and the other that thinks high inflation will become a lingering problem even if the market crashes and we fall into recession. According to the World Bank, whether or not a recession occurs, “the pain of stagflation [low growth + inflation] could persist for several years.” (global growth is projected to slow from 6.1% in 2021 to 3.6% in 2022 and 2023, largely due to the war in Ukraine, says the IMF)
Recession, stagflation, and a weaker US dollar are all likely outcomes.
This will cause the Fed to reverse course and start lowering interest rates again, a repeat of the “quantifornication” policy the Fed has been following on and off since the financial crisis.
Goldman Sachs economists expect that two 75 basis-point rate hikes over the summer could sap US growth, thus adding to recession fears and stoking gold investment demand.
In my next article I will show you why I believe the commodities and precious metals bull market, the super-cycle, is not only not over but is just getting started.
(By Richard Mills)


Comments