It’s crunch time for gold and the U.S. Dollar Index (USDX), as they find themselves at a crossroads. As of Wednesday, the USDX is holding its lows but wants to move up, thus invalidating its breakdown. And gold? Well, gold did gain a bit today, but it’s essentially jumping up in an elevator that’s moving down – it just doesn’t have enough steam to break out.
While it’s been the traditional view that when the US Dollar declines, gold increases in price, we find that’s not always the case when comparing historical patterns. And just to watch the price of gold itself when making a buying decision is not enough. One needs to pay attention to the price of gold in relation to moves in the USDX – that helps to indicate the bottom.
Let’s pay attention to and examine what gold does when the USDX moves either up or down.

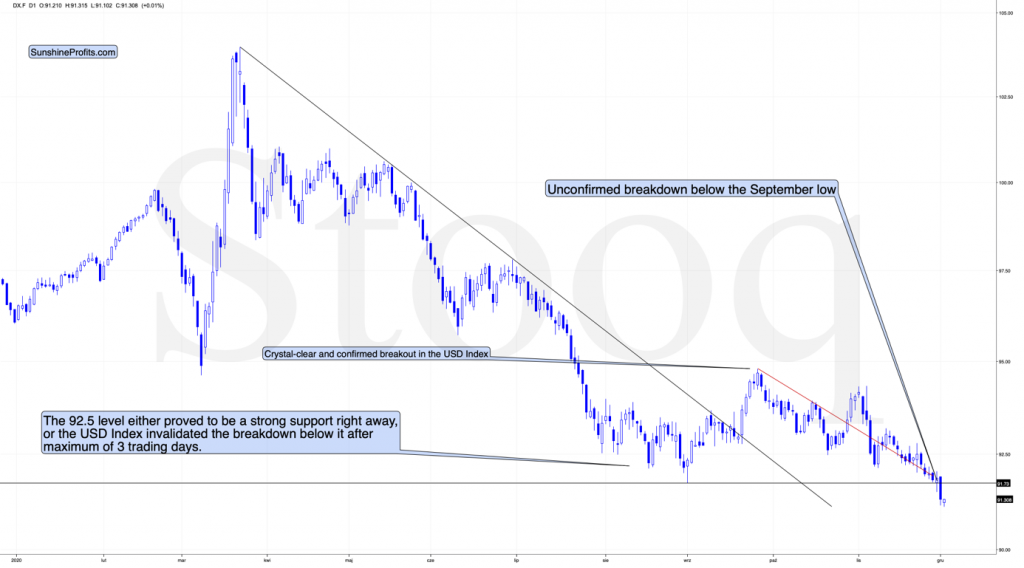
Yesterday we saw the first daily close below the September low. This means that the breakdown is not confirmed, and if the USDX closes below this level also today and tomorrow, it will be. However, at the moment of writing these words, the USDX is trying to rally back up – if it is successful, gold would be likely to plunge.
Still, to be precise, since gold just managed to rally above the declining resistance line, it might have enough momentum to reach the September low (at about $1,850) before turning south once again.
The breakdown in the USDX is not confirmed and it could be invalidated any hour now, but… What if it’s not? What if – despite invalidation being likely and the USDX moving up – what we’ve seen in the last couple of months was not the broad bottom in the USD Index, and the latter is going to decline from here?
These are important questions. First of all, if the above is indeed the case, it won’t mean that technical analysis became useless or less useful. It would mean that a different part of history is likely to be repeated to a certain extent, and not the ones that I featured and referred to previously.

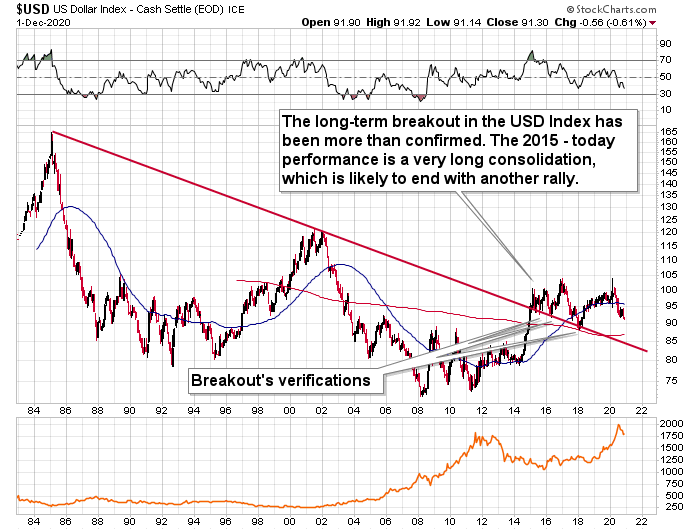
The above wouldn’t invalidate the very bullish implications of the long-term breakout in the USDX in 2015.
So, what would be likely to happen if the USDX declines in the next few days?

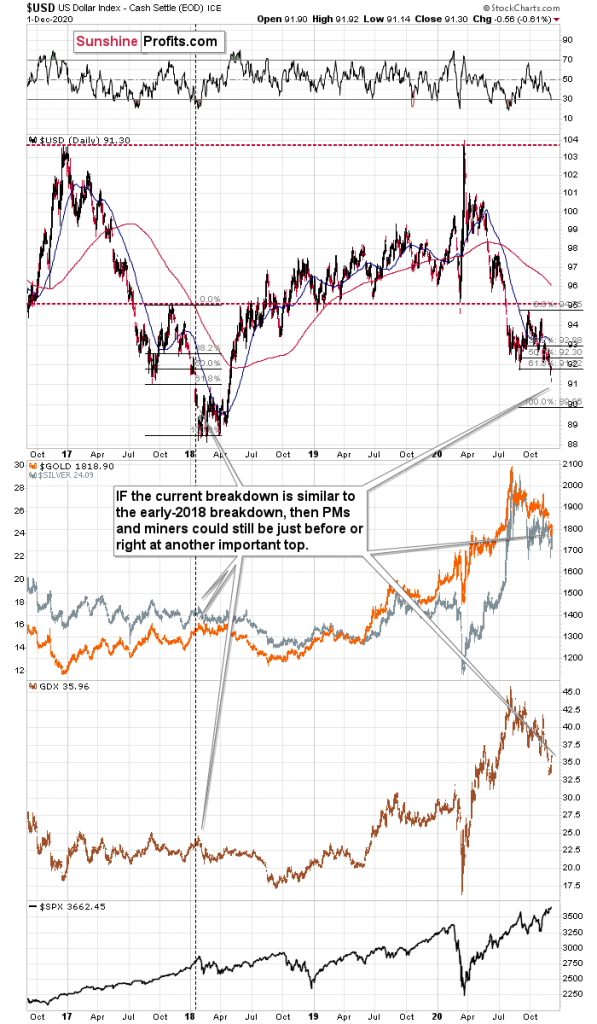
In this case, it seems likely to me that the USDX would repeat its 2017 – 2018 decline to some extent. The starting points of the declines (horizontal red line) as well as the final high of the biggest correction are quite similar. The difference is that the correction was now smaller than it was in 2017.
Since back in 2018, the USDX’s bottom was at about 1.618 Fibonacci extension of the size of the correction, we could expect something similar to happen this time. Applying the above to the current situation would give us the proximity of the 90 level as the downside target.
But would gold soar in this case? Well, if the early 2018 pattern was being repeated, then let’s check what happened to precious metals and gold stocks at that time.
In short, they moved just a little higher after the USDX’s breakdown. We marked the moment when the U.S. currency broke below its previous (2017) bottom with a vertical line, so that you can easily see what gold, silver, and GDX were doing at that time. They were just before a major top. The bearish action that followed in the short term was particularly visible in case of the miners.
Consequently, even if the USD Index is to decline further from here (and – again – the breakdown could be invalidated shortly), then the implications are not particularly bullish for the precious metals market.
(By Przemyslaw Radomski)
Comments
Adams
Changing the time frames on your analysis would lead a different scenario for gold. The correction we see since August was about to be broken. Then vaccine news pushed that reverse move down again. But it is almost over now and gold is starting another leg in the long term bullish line from late 2019.