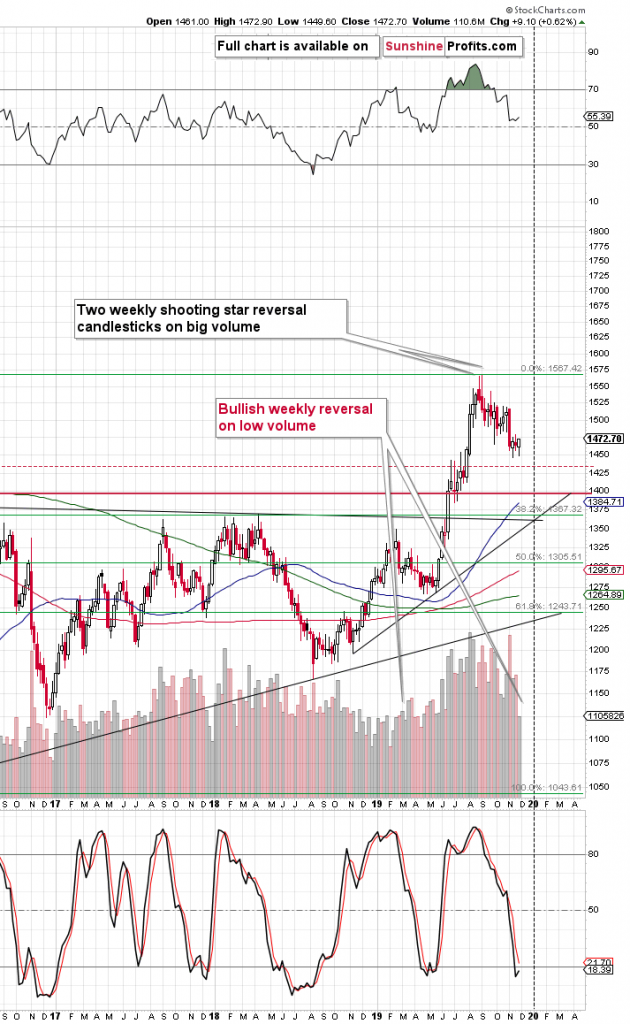
Just when most traders thought that the previous week is going to end in the red for gold, something exceptional happened. The USD Index reversed after rallying, and gold rallied sharply in response. In the end, gold ended the week in the green by forming a clear weekly reversal.
That was actually the second weekly reversal that we saw recently. Why is this important? Because of what happened shortly after we saw the opposite of it not so long ago.

The August and early-September reversals were followed by sizable short-term declines and the combined reversals themselves have most likely created the 2019 top.
The opposite of what created the major top, should create a major bottom now, right? Not so fast. The double reversal is indeed bullish, but there’s one more detail to pay attention to before calling a major bottom in gold. Gold’s volume.
The volume that accompanied the August and September reversals was big, and the volume that we saw recently – especially last week – was small. Sure, it was the long Thanksgiving weekend, which means that fewer traders were making transactions, which explains why the volume was low. Still, knowing what’s below the low volume’s surface doesn’t change the fact that low volume means that the candlestick formations (like the weekly reversal) should not be taken at face value. They give some hints, but they are not as reliable as if they took place on huge volume.
The recent situation is more similar to what we saw in early March. There was a clear weekly reversal, but it was accompanied by low volume. And what happened shortly thereafter? Gold rallied, but not significantly so. At least not within the next several weeks. This tells us that the recent reversals – while bullish – are not too bullish and not beyond the next week or a few of them. Perhaps not even beyond the next several days.
What would one use to forecast a top in gold prices within this week?

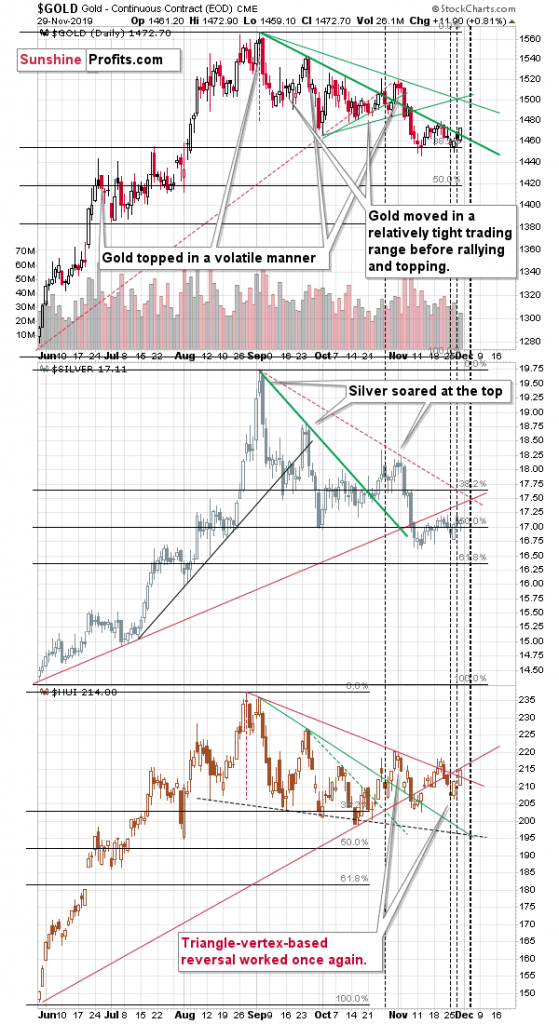
Because of the looming triangle-vertex based turning point. The recent turning points for gold, silver and mining stocks worked perfectly by pinpointing the early November top, and they also correctly estimated the most recent reversals – the local bottoms after which gold, silver and miners moved higher.
The early November top is clearest in case of silver (middle of the above chart), while the recent local bottoms are most clearly visible in case of gold miners (lower part of the chart).
The next triangle reversal is due this week, which makes it likely that we’ll see some kind of turnaround shortly. The important details about this turnaround is that it’s confirmed by not one but two markets – silver and miners, which increases the odds that the reversal will indeed take place. The early-November top, for instance, was indicated by all three parts of the PM market at once.
Let’s keep in mind that it’s not the only factor pointing to this outcome. The True Seasonality for gold confirms the above.

On average, gold price has been spiking around late November and early December. Please note that while on average gold performs best in late November, the accuracy reading actually rises strongly in the next several days. This means that while the biggest price moves usually happened sooner, some of them arrive a bit late. When gold soared sooner, it didn’t decline immediately. The take-away here is that even if the above is not 100% correct, and price spike doesn’t happen right away, it means that it’s still likely to arrive shortly.
Based on the weekly candlestick reversals in gold, the looming triangle reversals, gold’s True Seasonality, and other factors, it seems that gold is going to rally and top shortly.
Apart from outlining the take-profit targets of our long position opened right after the November 12 reversal, the full version of this analysis features a valuable sign from yesterday’s action in mining stocks, and the analysis of gold’s upcoming very short-term moves and targets. Bottom line, these are invaluable tools in planning when and where to profitably switch market sides – just as our preceding success with the earlier short position. Please note that you can still subscribe to these Alerts at very promotional terms – it takes just $9 to read the details right away, and then receive follow-ups for the next three weeks. Profit along with us.
(By Przemyslaw Radomski)
All essays, research and information found above represent analyses and opinions of Przemyslaw Radomski, CFA and Sunshine Profits’ associates only. As such, it may prove wrong and be a subject to change without notice. Opinions and analyses were based on data available to authors of respective essays at the time of writing. Although the information provided above is based on careful research and sources that are believed to be accurate, Przemyslaw Radomski, CFA and his associates do not guarantee the accuracy or thoroughness of the data or information reported. The opinions published above are neither an offer nor a recommendation to purchase or sell any securities. Mr. Radomski is not a Registered Securities Advisor. By reading Przemyslaw Radomski’s, CFA reports you fully agree that he will not be held responsible or liable for any decisions you make regarding any information provided in these reports. Investing, trading and speculation in any financial markets may involve high risk of loss. Przemyslaw Radomski, CFA, Sunshine Profits’ employees and affiliates as well as members of their families may have a short or long position in any securities, including those mentioned in any of the reports or essays, and may make additional purchases and/or sales of those securities without notice.
Comments