The US dollar is simply the best of all evils
In two musings last November, I explored the correlations of metals and oil prices with the US dollar index (Mercenary Musings November 14, 2014; November 24, 2014). My treatment documented strong negative correlation coefficients for DXY with world-exchange traded commodities from mid-July thru late November. I will update the data and present current thoughts below.
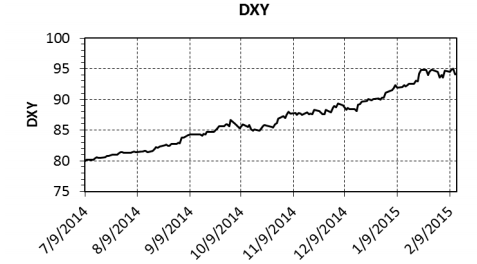
DXY closed at 79.99 on July 9 and then began a sustained uptick.
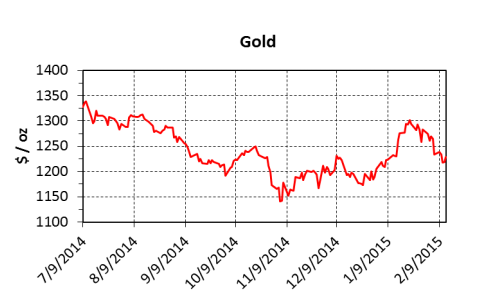
Meanwhile, gold made an impressive run in January and touched $1300/oz when the Swiss cut currency ties with the Euro. Since then, the price has weakened and backed off to the low $1200s over the past week:
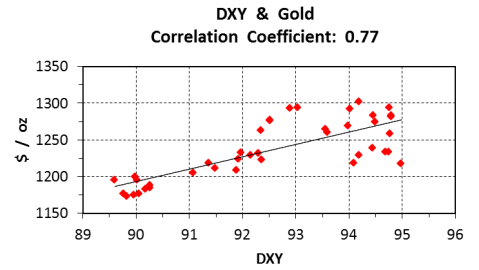
From July 9 to November 22, the DXY and gold correlation coefficient was -0.96. An inverse relationship is a usual paradigm because gold priced in US$ will concomitantly go up or down as the dollar weakens or strengthens. Of course, there are many other factors that can affect the value of gold. Subsequent to this musing, the dollar and gold established a rare positive correlation beginning in midDecember (Mercenary Musing January 26, 2015). Here’s the correlation chart from December 19 to February 13:
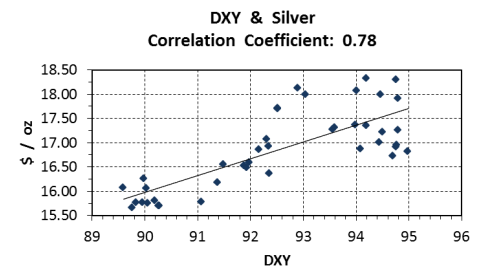
Since mid-July, silver has been relatively weak and has traded in synchronization with gold but with its usual higher volatility. Currently the Au:Ag ratio is in the low to mid-70s, levels not seen since the fall of 2008. Here’s the silver price chart:
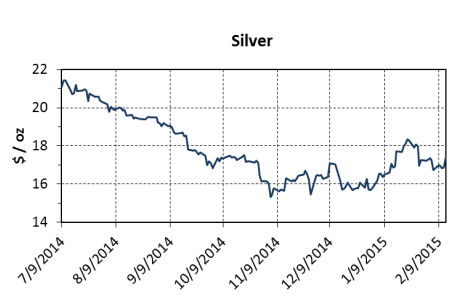
Silver’s correlation with DXY thru late November was almost perfect at -0.98. Because it mimics the movement of gold, silver also shows a positive coefficient from December 19 to the present. That said, the data has become quite scattered since the dollar index reached 94:
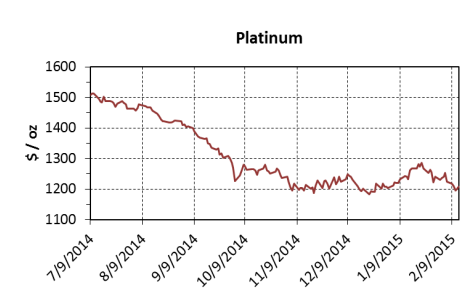
Platinum was extremely weak losing 25% of its value from July to November whereupon it stabilized in the $1200 range. Platinum is once again trading at a discount to gold with the current ratio at a little less than 1.0.
The noble metal’s weakness comes despite strong demand for petroleum-fueled vehicles in China and the United States and all-in mining costs for dominant producer South Africa far exceeding the current price:
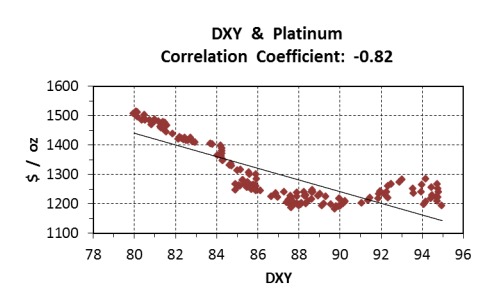
The DXY correlation coefficient was -0.98 in my previous musing. Although platinum retains a strong inverse correlation to the dollar index, it has shown divergence from a rising dollar in the new year:
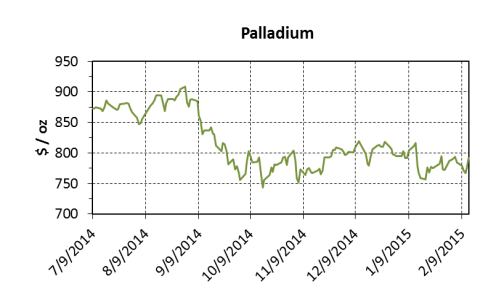
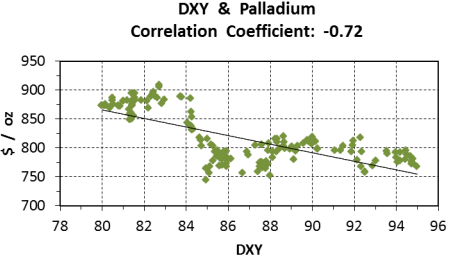
Meanwhile, palladium has traded in a somewhat contrary fashion to the other precious metals. It reached a 13.5 year high in August; then its price was affected by the strong US dollar. The Pt:Pd ratio now stands at about 1.5, a low not seen for nearly 12 years.
The fact that palladium is largely an industrial metal, the aforementioned strong demand for gasolineburning automobiles, and major producer Russia’s collapsing currency due to economic sanctions and low oil prices account for its strength relative to the other precious metals:
Palladium has a seven month correlation coefficient of -0.72 and has been range-bound recently despite the rising dollar:
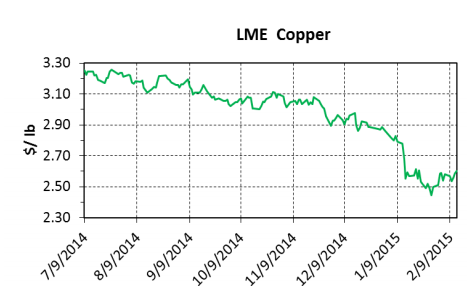
Copper is the most important industrial metal traded on the world stage. It has exhibited prolonged weakness in periodic steps downward, losing 20% in US dollar terms since July. China’s slowing economic growth has weighed heavily on speculation in copper and other industrial metals. However, copper has a projected supply deficit for 2015, there are low warehouse stocks worldwide, and annual demand growth continues unabated.
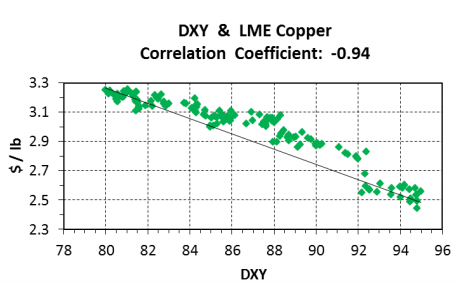
Previously, DXY and copper were negatively correlated at -0.85. That relationship has now strengthened significantly:
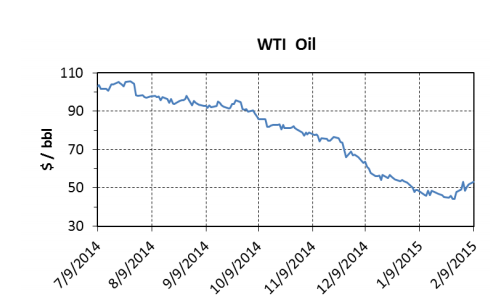
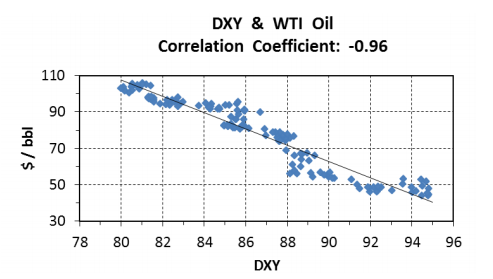
Now let’s look at the collapse in crude oil prices over the past few months. Although it is the commodity most subject to geopolitical events and we have certainly had a bevy of those lately, oil has lost over 50% of its value since July 9. This dramatic fall from a sustained period of $100/bbl prices is a function of steadily increasing supply from North American unconventional producers and a lessening of demand worldwide.
Oil traded as low as the mid-$40s in January but has rallied to the low $50 range this month:
In late November, the DXY to WTI correlation stood at -0.90. In the intervening three months, oil has developed an even stronger inverse correlation with the US dollar:
These charts combined with supply-demand fundamentals allow some short-term predictions on the US dollar and commodity prices:
- The dollar index has stalled in the 94 range and could hold there for a while. Given a current economic paradigm of stagflation amid a worldwide race to devalue fiat currencies, the US dollar
is simply the best of all evils. The greenback is increasingly viewed as a safe haven, and I expect it to go even higher in 2015. - The positive correlation of gold and DXY is quite unusual and last occurred during the global economic crisis in early 2009. That said, with shaky economic news coming out of Europe,
Japan, the BRICS, and many Third World countries, physical gold is the only real money and therefore, remains in strong demand. I do not expect gold to make any major moves in the short
term, but do think it will close 2015 higher than it started the year. - Although more volatile, silver moves in conjunction with gold, the real precious metal. Although silver is used mostly in industrial processes, hoarders have created an excess of physical supply that continually overhangs the market. Also, many people buy silver when the Au:Ag ratio is high with the intent of trading for gold when the ratio goes lower. In my opinion, these factors do not bode well for silver bugs in the short-, mid-, or long-term.
- The fundamentals for noble metals remain strong. I expect the platinum price to recover nicely within the next year and its ratio to palladium to reach more normal levels.
- Supply-demand fundamentals remain strong for copper. The all-in cost for producing a pound of copper worldwide likely averages about $2.50 per pound. If the current spot price of $2.60 lingers, highest quartile producers will curtail or shut down production in the near-term. Then, as always, the price will rise.
- Although two weeks of stronger prices is not much prologue, oil may have reached the bottom. I fully expect oil prices to rebound to a sustainable $70/bbl range within the next year or so. At his price, legitimate and fiscally well-run domestic shale oil producers will have sufficient netbacks to prosper. Nevertheless, the growth rate of this largely US industry will slow dramatically for the foreseeable future.
Editor’s note: originally published Feb. 19, 2015

{{ commodity.name }}
{{ post.title }}
{{ post.date }}


Comments